Recommended Budget Allocation
The budget allocation is calculated based on the slope of the various significant factors with respect to Secondary Gross Enrolment Ratio, Secondary Dropout Rate and Learning Outcomes (target variables). If a factor has high slope with respect to any of the above 3 target variables in a linear regression setting, then that factor has to be allocated more budget than others. The methodology also takes into account the population of each district/taluk and distributes the budget in such a way that if a particular district/taluk has more people who are affected by a factor x, then we allocate more amount to that district/taluk in order to control that factor.
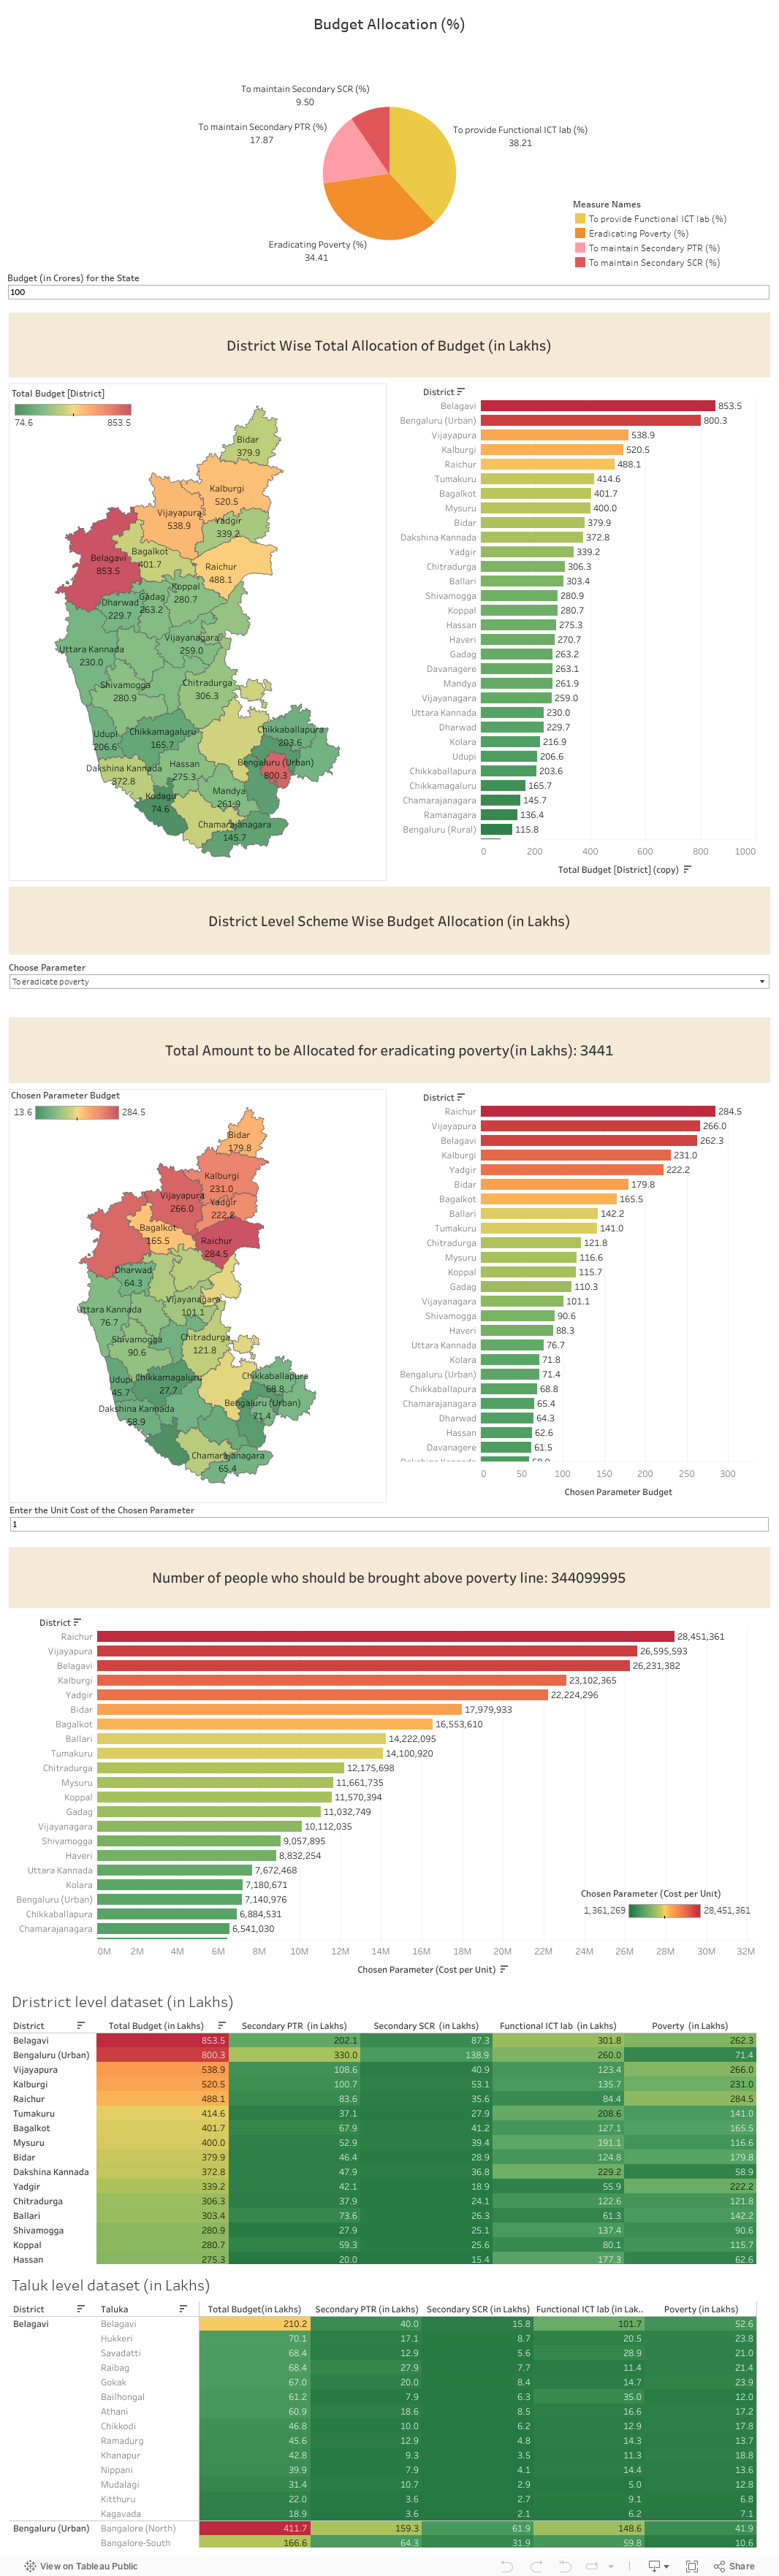
In the below dashboard, the pie chart at the top depicts the state level budget allocation for the various significant factors. If you click on a particular district in the district map, you can also see the budget allocation for that particular district. Below the pie chart, there is a field where you can specify the amount that has to be given for the state for making secondary GER to 100%, secondary dropout rate to 0% and learning outcomes to 100%. After you specify, the amount and press enter, you can see that the dashboard automatically distributes the amount to all the districts based on the impact.
The first district map shows the total amount allocated for the districts. To the right of it, you can also see the corresponding bar chart. By hovering over a district in the district map, you can see the total amount allocated to the taluks in that district. Similarly, if you hover over a particular bar (corresponding to a district), you can see the bar chart for the taluks in that district. By clicking on a particular district in the map, the entire dashboard provides the details for the selected district.
The second district map shows the scheme wise budget allocation for the districts. You can select the variable from the dropdown menu provided. Correspondingly, you can see the total amount allocated for that variable at the state level. Below this, you can see the district level budget allocation for the chosen variable. Here as well, when you hover over a particular district, you can see the taluk level budget allocation for the chosen variable. To the right hand side, there is corresponding bar chart for the district. When you hover over a particular bar, you can see the taluk level bar chart.
Below the second district map, there is a field where you can enter the unit cost of the chosen variable. This calculates the number of beneficiaries/facilities that has to be provided by the government.
The bottom two dataset represent the budget at the district level and taluk level (in lakhs)
The below dashboard also takes into account the suggestions given by the domain experts.