This data story analyses various factors from multiple sources that are highly correlated with the HDI at the taluk level and uses predictive analysis to estimate the impact of changes in each factor on districts and taluks. The interactive dashboards are based on the report “Indicators And Its Impact Across Poverty, Health & Education Sectors“. Please click here to view/download the report.
HDI Factors
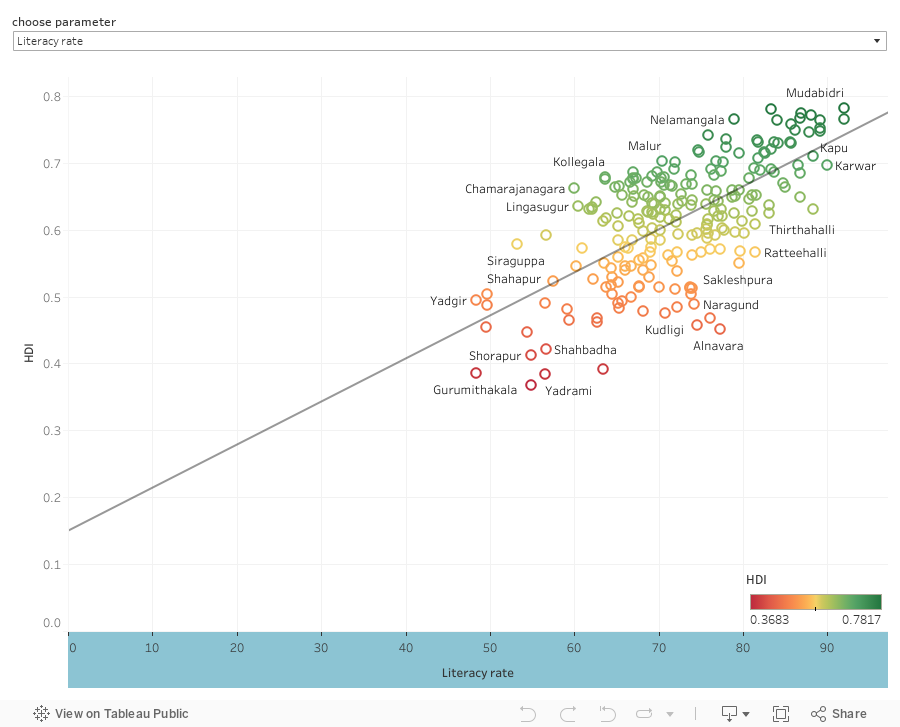
You can select the variable for which you want to see correlation with HDI, from the dropdown menu.
If the p-value for a variable is less than 0.05, then that variable has a significant correlation with HDI. While many factors have significant correlation to HDI , the following have been identified as impact factors in consultation with the domain experts.
Impact Factors
- Literacy rate
- % count of people deprived school attendance
- % count of people deprived House Malnutrition
- Per Capita Income (at constant prices)
- Percentage of households not having access to toilet
- Percentage of Households not having access to modern cooking fuel
- % count of people deprived Maternal health
- % count of people deprived Bank account
- SSLC Result (5 years average prior to 2020-21)
Predictive Impact Analysis
The dashboard has a slider using which, you can change the factor of interest. Initially, the slider is at 0%. If you want to decrease the factor by 10%, you can move the slider to the left. Similarly, if you want to increase the factor by 10%, you can move the slider to the right.
For example, say you want to increase “Literacy rate” by 20% of the current value, you can do it by moving the slider two times to the right (which corresponds to +20%)
The dashboards has district level map as well as taluk level map. The colours on these maps represent the change in HDI after making the desired change in the factor of interest. If you hover over a particular district in the district level map, you get a magnified image of those taluks belonging to that district.
Below the maps, you can see the score of each taluk sorted in descending order. The scoring is based on how good each taluk has performed in changing yield after changing the factor.
At the very bottom, you can see the dataset that is being used for making this interactive visualization

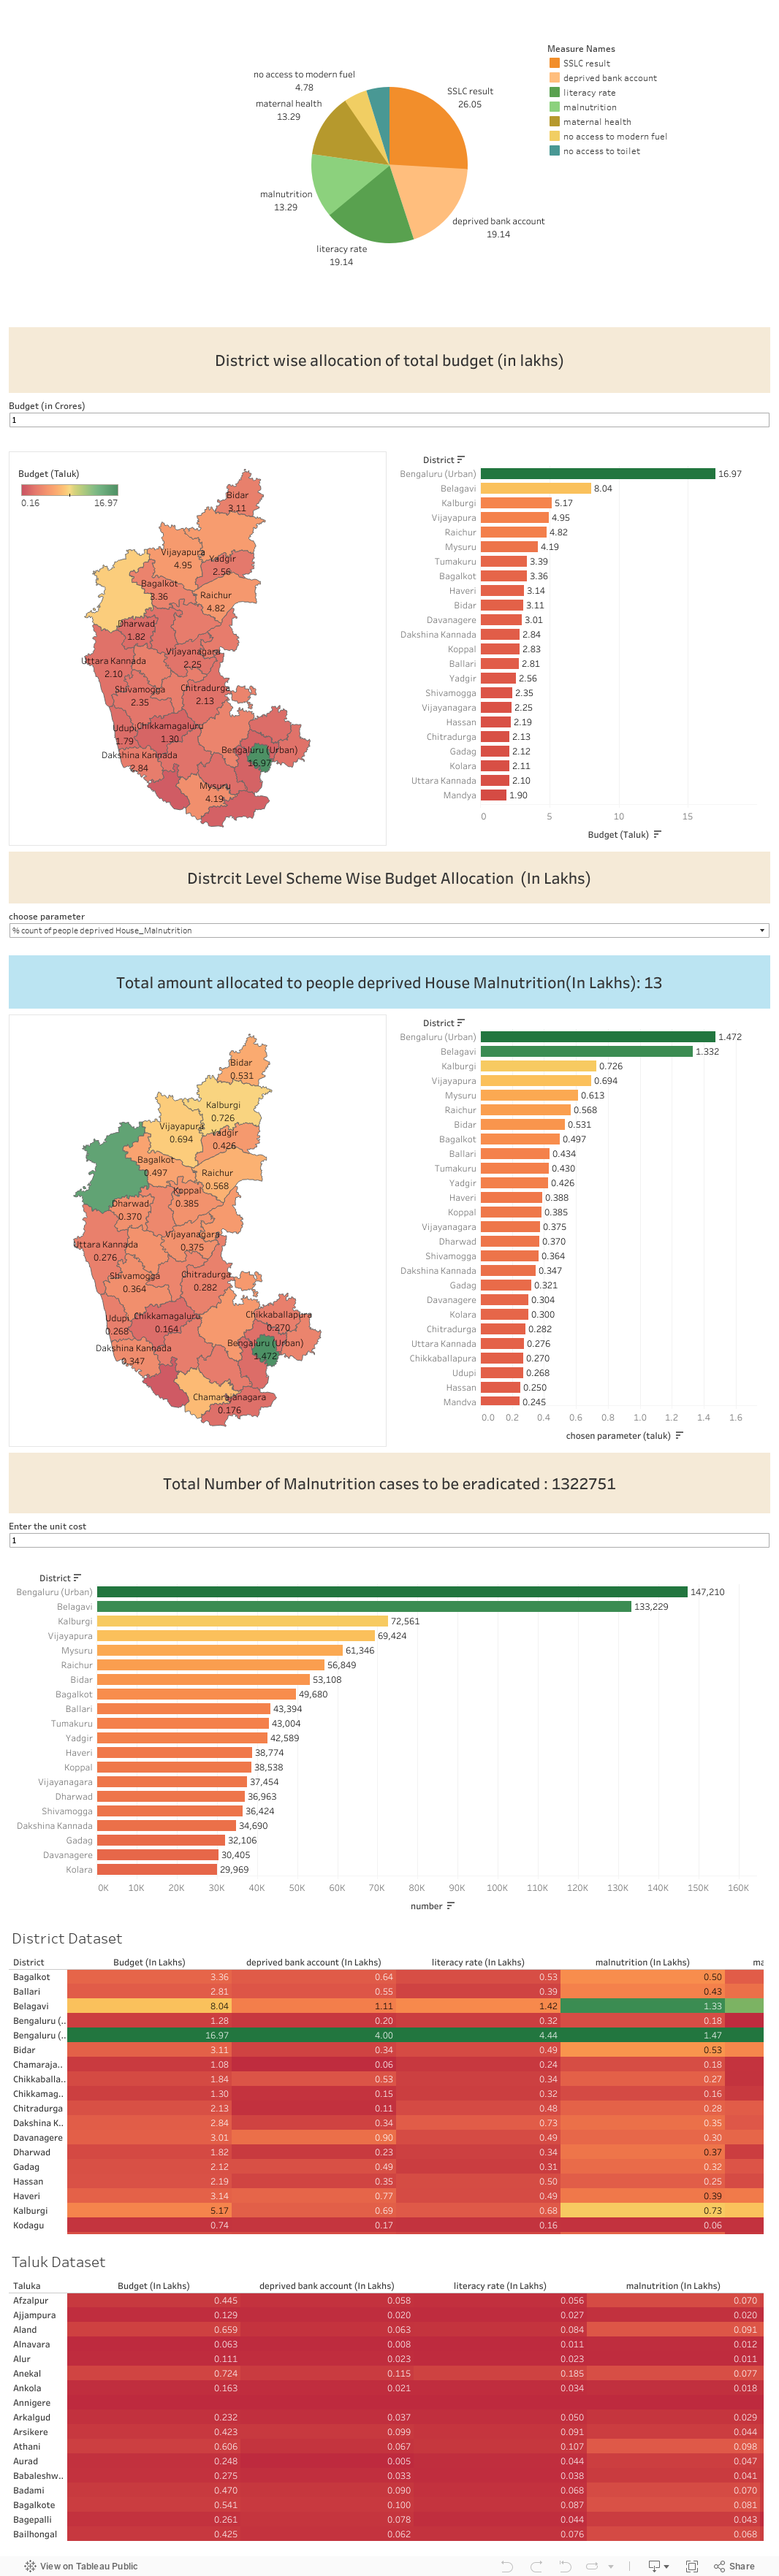
Recommended Budget Allocation For Increasing HDI
The budget allocation is calculated based on the correlation of the various significant factors with HDI. If a factor has high correlation with HDI, then that factor has to be allocated more budget than others. The method also takes into account the population of each district/taluk and distributes the budget in such a way that if a particular district/taluk has more people who are affected by a factor x, then we allocate more amount to that district/taluk in order to control that factor.