Model Description:
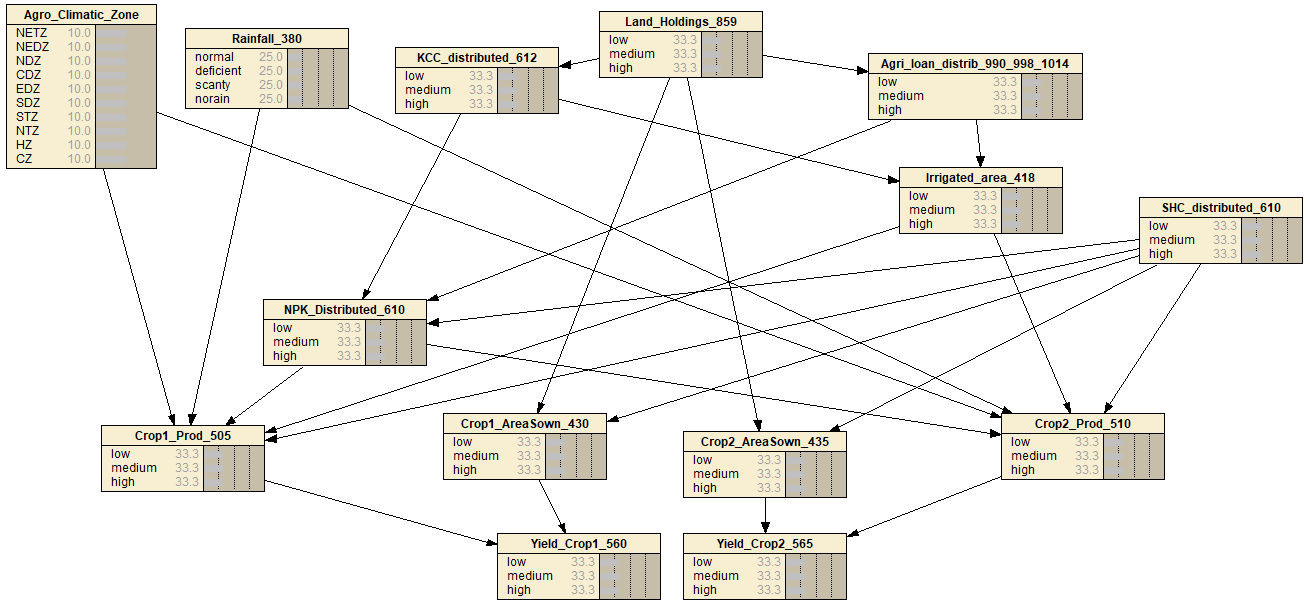
A Bayesian network model for crop yield is shown below. This is a multi-target model which captures primarily the factors related to the production, the area sown, and the yield of two primary crops (rice and wheat). Dependency relationships between the nodes are established from government reports and published literature.
Model:
Nodes/Attributes:
The above model is based on the following nodes. The color scheme used represents the type of node/attribute. (Purple – Independent node; Orange – Dependent node; Red – Target node)
| Node/Attribute | Description | DataSource |
| Agro-Climatic Zone | Climate suitable for major types of crops | KAG 2020-21 |
| Rainfall | Annual rainfall recorded in mm | KAG 2020-21 |
| Landholdings | Possession of land | KAG 2020-21 |
| Agriculture loan distributed | Average of agriculture loans distributed by public, private and regional banks | KAG 2020-21 |
| KCC distributed | Kisan credit cards distributed | KAG 2020-21 |
| SHC distributed | Soil health cards distributed | KAG 2020-21 |
| NPK distributed | Fertilizers distributed | KAG 2020-21 |
| Irrigated area | Irrigated Land Area (hectares) | KAG 2020-21 |
| Crop 1 – Area Sown (Rice/Paddy) | Area sown for crop 1 (say paddy) hectares | KAG 2020-21 |
| Crop 2- Area Sown (Wheat) | Area sown for crop 1 (say paddy) hectares | KAG 2020-21 |
| Crop production 1 (Rice/Paddy) | Production (kgs) of crop1 | KAG 2020-21 |
| Crop production 2 (Wheat) | Production (kgs) of crop2 | KAG 2020-21 |
| Crop Yield 1 (Rice/Paddy) | Yield of crop 1 in kgs/hectare | KAG 2020-21 |
| Crop Yield 2 (Wheat) | Yield of crop 2 in kgs/hectare | KAG 2020-21 |
- Note: The attributes are chosen from KAG 20-21 dataset. The model can be improvised with additional data and facts accordingly.
Attribute Correlation Matrix :
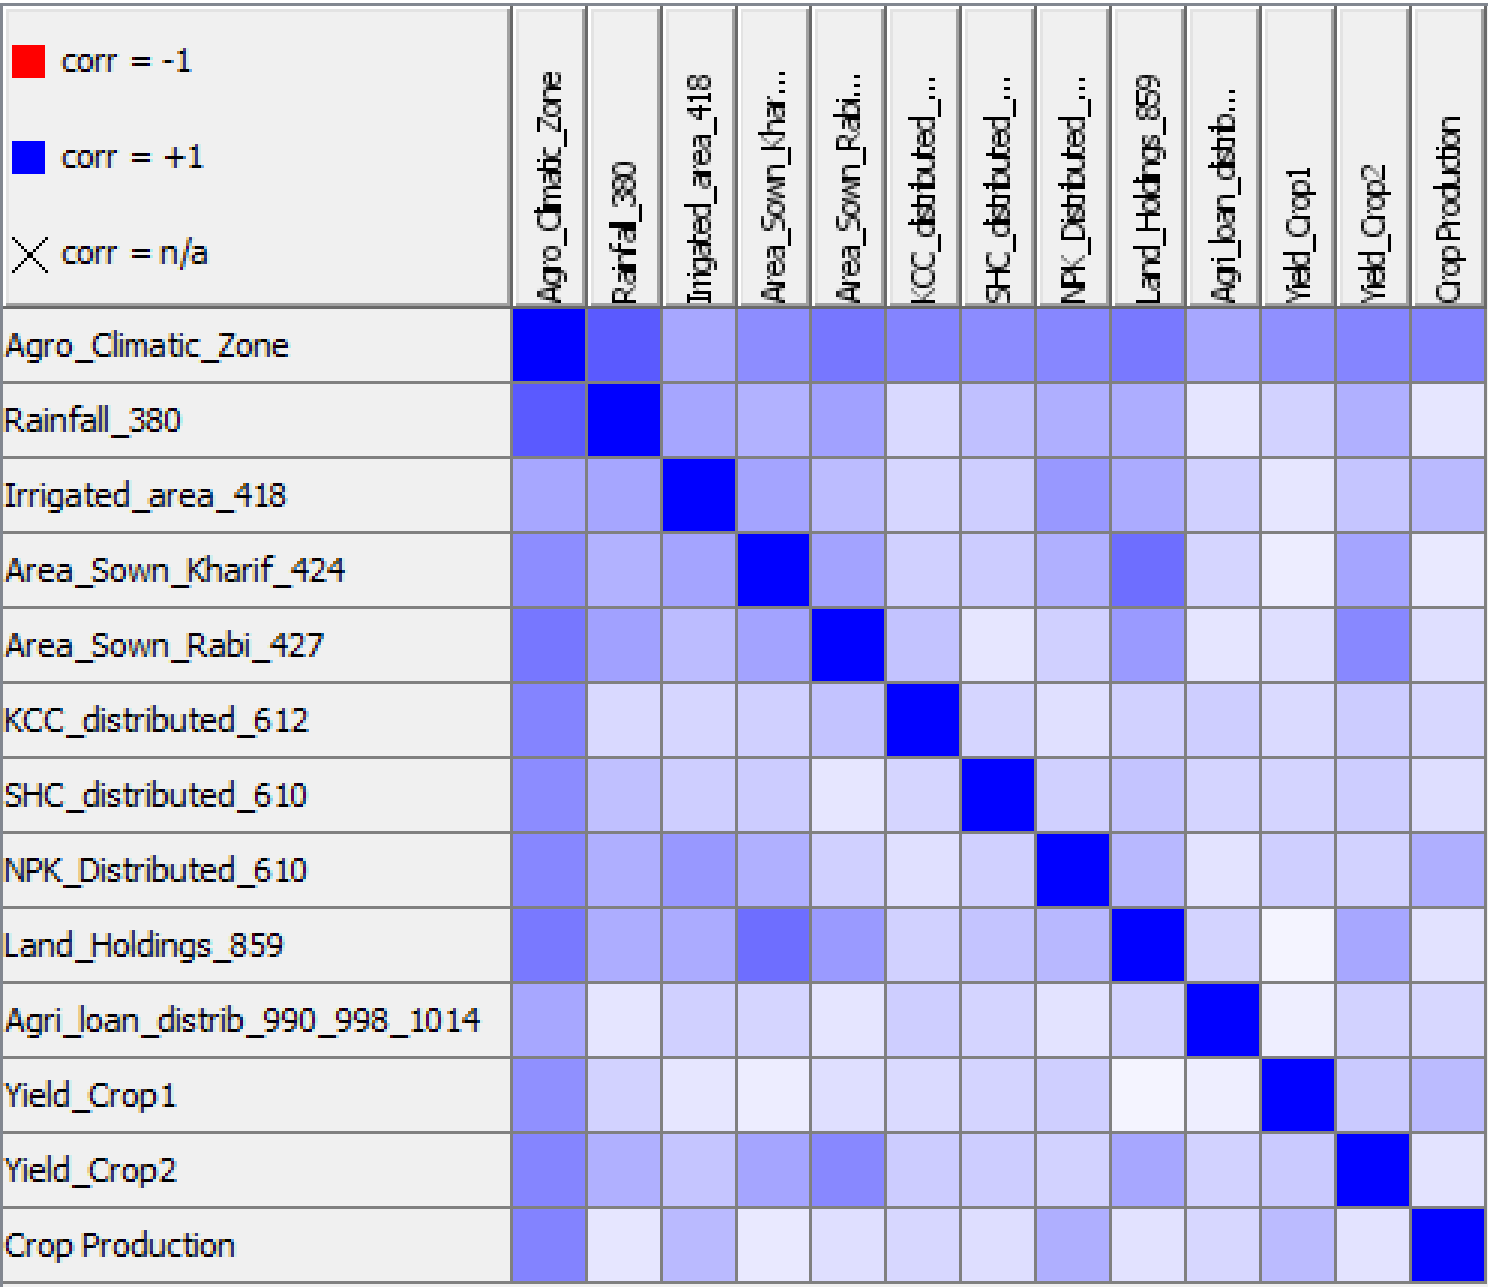
The correlation Matrix shows that attributes are correlated with many others, and provides a strong statistical basis to support further investigation to unravel potential linear and non-linear relationships
Intervention Modeling :
It sets the network variables to specific levels, to track the changes in the target variable in the network. For instance: If we fix the value of the variable ‘Fertilizer consumption’ to ‘low’, then we would study the impact of this intervention on the target variable i.e., “Crop Yield” of the network across various geo-entities of the state.
| Intervention Code | Intervening Node | Description | Ease of Intervention [1-most difficult, 5-easy] | Total Models Impacted | Models Impacted | Domains Impacted | Data Stories impacted upon intervention |
| I1 | NPK distributed | Intervening in the distribution of synthetic fertilizers to study the impact on crop yield | 4 | 0 | 0 | 0 | 1. Modeling The Intervention Of NPK Consumption On Crop Yield 2. Stress Modelling 3. Top and Bottom 5 Taluks (Rice) 4. Top and Bottom 5 GPs (Rice) 5. Predicted Change In Rice Yield After Making NPK Consumption To Br High |
| I2 | Agriculture loans distributed | Intervening in the distribution of agricultural loans from public, private and regional banks | 3 | 0 | 0 | 0 | |
| I3 | Land holdings | Increasing marginal and small farmer land holdings area | 1 | 0 | 0 | 0 | |
| I4 | Land area sown | Increasing the area of land to sow crops during Rabi and Kharif seasons | 4 | 0 | 0 | 0 |
DISCLAIMER: AI predictive models are meant to support and augment expert decision-making, and not a replacement for the same. It is important for AI model predictions to be vetted by domain experts before committing to action