This data story considers different factors from multiple sources that have a high correlation with Gross Enrolment Ratio (GER) across taluks, and builds predictive models of expected impact of changing each factor for each district and taluk. Based on the correlations, the recommended budget allocation for different schemes/factors is also given. At the bottom, you can also see an interactive dashboard where you can perform a particular intervention and see whether it is stable or not.
GER Factors
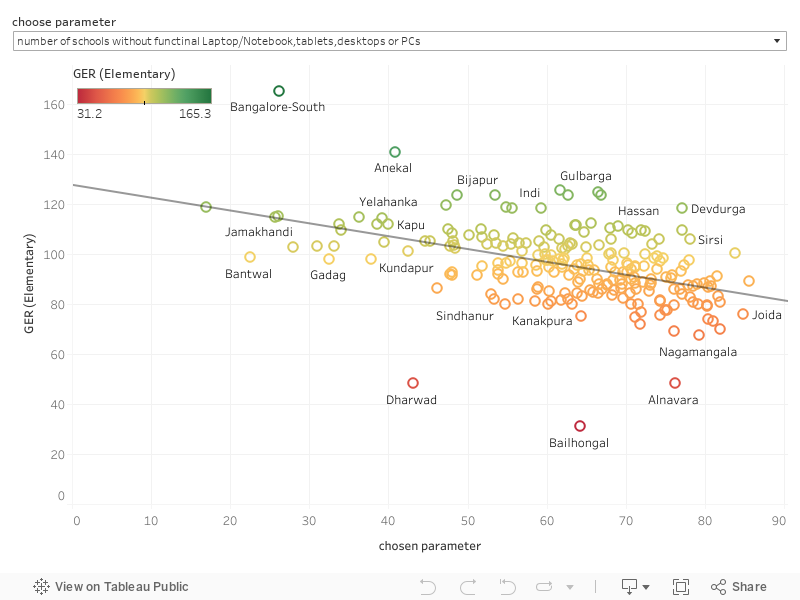
You can select the variable for which you want to see correlation with GER, from the dropdown menu.
If the p-value for a variable is less than 0.05, then that variable has a significant correlation with GER. While many factors have significant correlation to GER, the following have been identified as impact factors in consultation with the domain experts.
Impact Factors
- number of schools without functional CAL lab
- number of schools without functional Laptop/Notebook, tablets, desktops or PCs
- number of schools with secondary SCR above 30
- number of schools with secondary PTR above 30
- number of schools without internet(%)
Predictive Impact Analysis
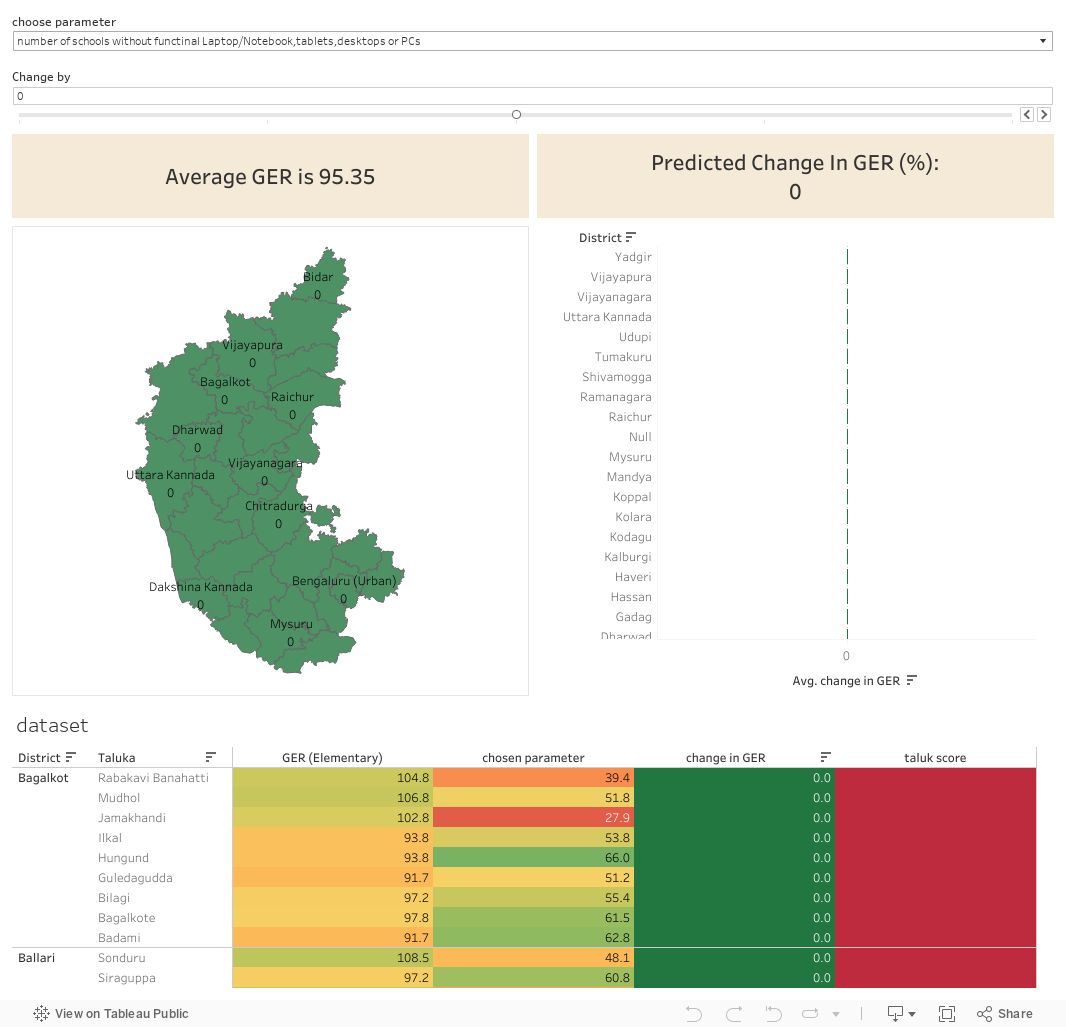
The dashboard has a slider using which, you can change the factor of interest. Initially, the slider is at 0%. If you want to decrease the factor by 10%, you can move the slider to the left. Similarly, if you want to increase the factor by 10%, you can move the slider to the right.
For example, say you want to increase the number of households having access to electricity by 20% of the current value, you can do it by moving the slider two times to the right (which corresponds to +20%)
The dashboards has district level map as well as taluk level map. The colours on these maps represent the change in GER after making the desired change in the factor of interest. If you hover over a particular district in the district level map, you get a magnified image of those taluks belonging to that district.
Below the maps, you can see the score of each taluk sorted in descending order. The scoring is based on how good each taluk has performed in changing yield after changing the factor.
At the very bottom, you can see the dataset that is being used for making this interactive visualization
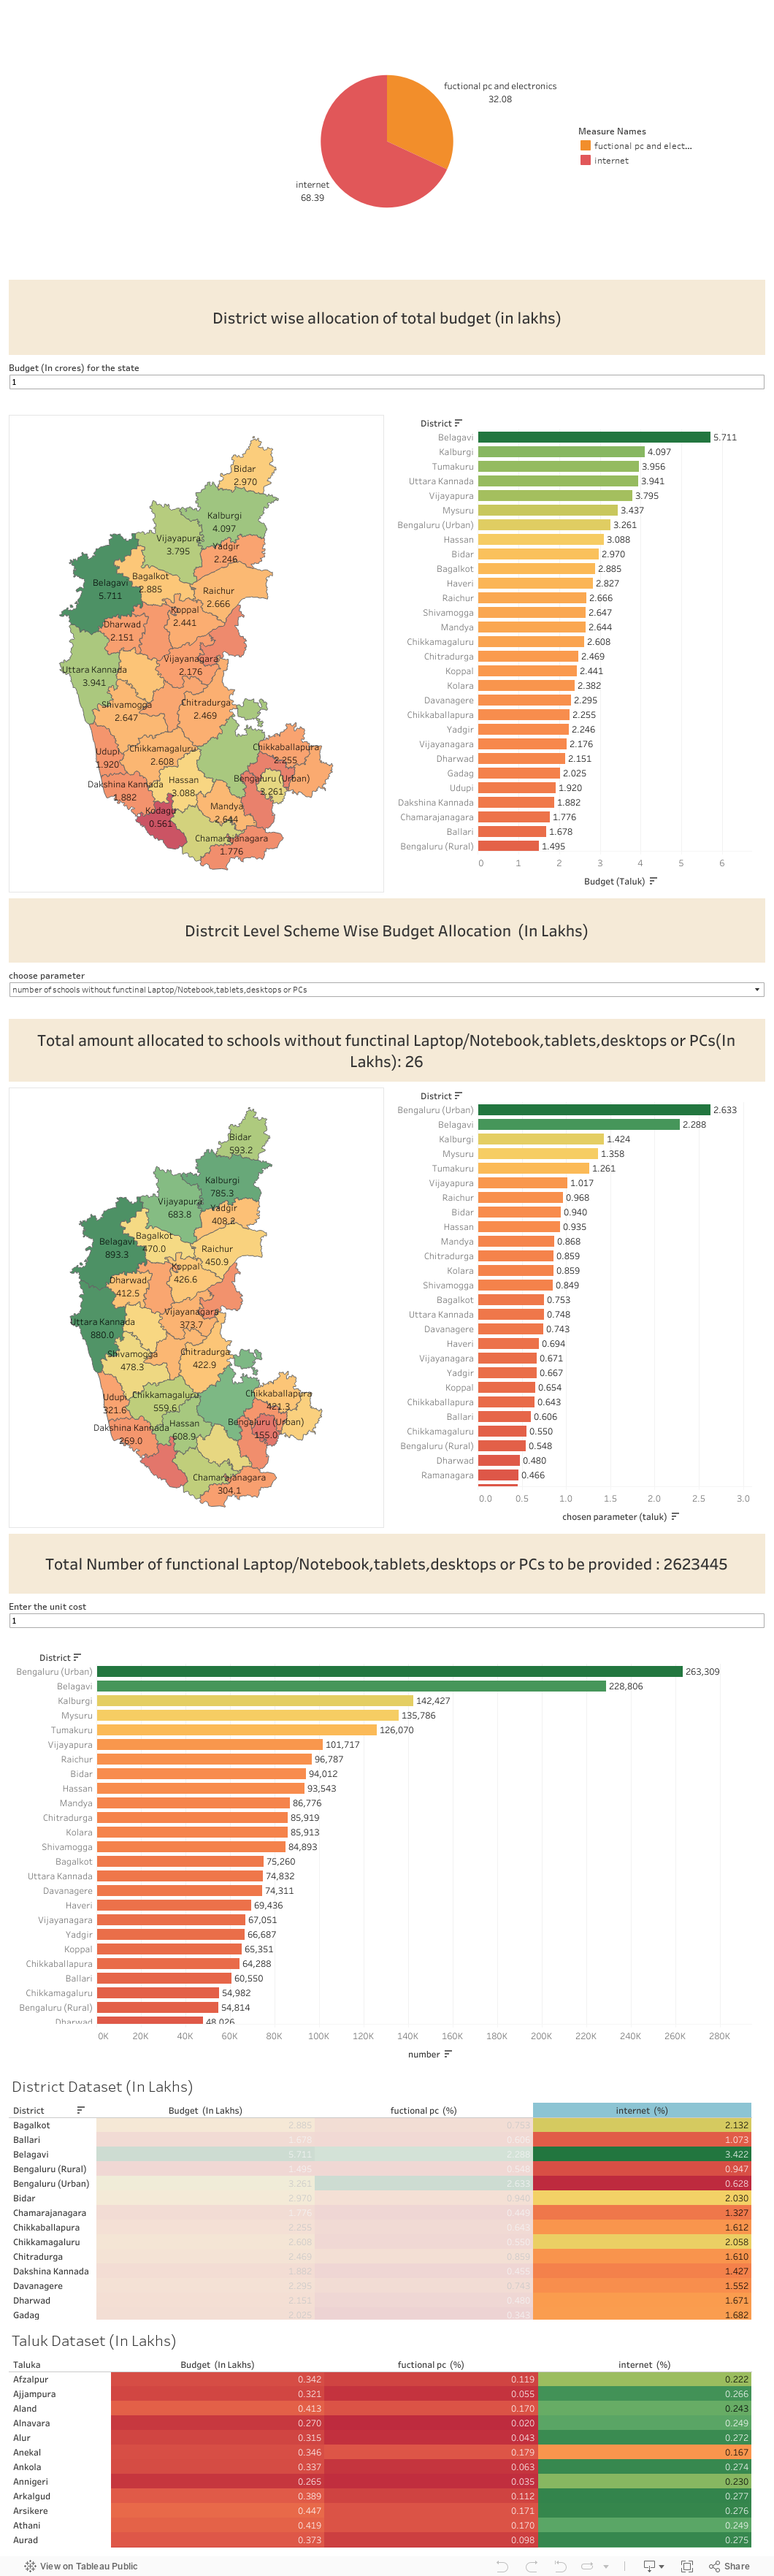
Recommended Budget Allocation For GER
The budget allocation is calculated based on the correlation of the various significant factors with GER. If a factor has high correlation with GER, then that factor has to be allocated more budget than others. The method also takes into account the population of each district/taluk and distributes the budget in such a way that if a particular district/taluk has more people who are affected by a factor x, then we allocate more amount to that district/taluk in order to control that factor.