January 2023
Data stories depicting the state of indicators pertinent to SDG Target 2.4 with respect to the Karnataka context, are described here.
Crop Resilience
A number of factors contribute to crop resilience. One of the simplest indicators of resilience is to plot the different seasons and agro-climatic zones (ACZs) in which a given crop can be grown. The following data story shows the footprint of several crops across seasons and ACZs.
Use the interactive map below to see the distribution of a given crop in terms of average yield in KGs per hectare across the state, as well as across ACZs and sowing seasons. For each crop, a ranking of taluks based on average yield is also shown.


The data story above shows a large disparity in the yield patterns of different crops. The following are some key findings from the above story:
- Paddy is one of the most diverse crops sown, covering 9 out of 10 agro-climatic zones. In most of the ACZs, paddy is sown in at least 2 of 3 sowing seasons, while in the Central ACZ, it is sown in all three seasons.
- Maize comes a close second. It is grown in 9 out of 10 agro-climatic zones. In most of the ACZs, it is sown in 1 out of 3 sowing seasons, while in the Northern Dry Zone, it is sown in 2 out of 3 sowing seasons.
- The other to major staple foods of the state– Ragi and Wheat are sown in only 4 of the 10 ACZs and mostly in one season.
- One of the biggest disparities in crop yields is seen for Sunflower. The crop is sown in only 18 taluks, with Shikaripura taluk outperforming all other taluks by a wide margin. Interestingly, Sunflower is sown in all three seasons in the Northern Dry Zone, but the lone taluk Shikaripura from the Southern Transition Zone, outperforms the more versatile growing pattern in Northern Dry Zone.
Agriculture Mechanization
The levels of mechanisation of agriculture varies vastly across the state, with large parts of the state largely relying on manual labour. This forms yet another dimension for consideration.
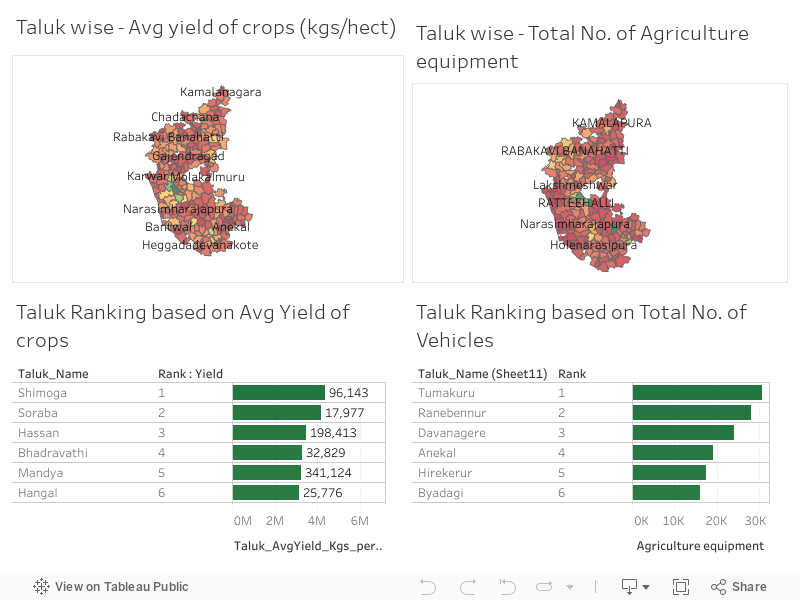
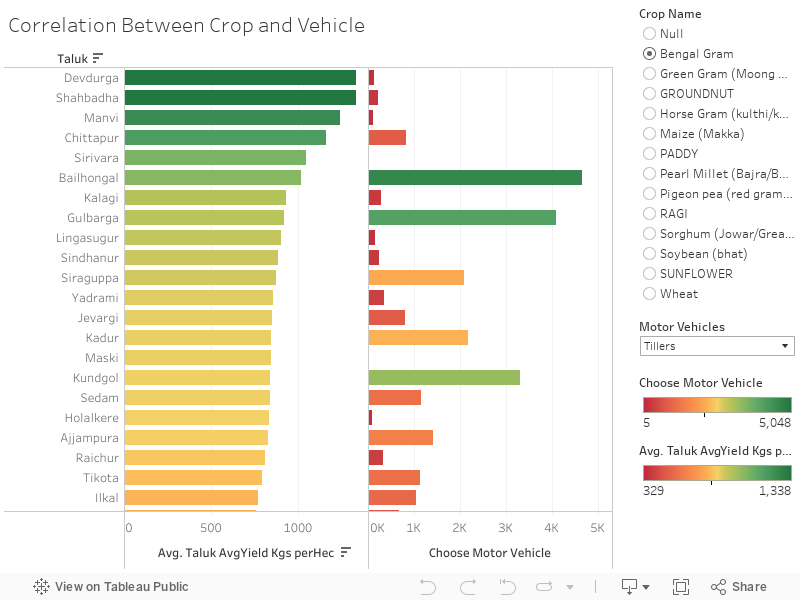
There is no significant correlation between the average yield of crop and the total number of vehicles in a particular taluk. For example, the taluk Tumakuru has the highest number of vehicles while the crop yield in this taluk is medium. It seems that increasing the number of vehicles in the taluks has no significant impact on crop yield.

Diversity of Cropping Pattern
Diversity in cropping patterns can help hedging risks by farmers and also improve soil health. A variety of factors affect diversity of cropping patterns, and understanding these may be important in improving resilience in crop yields.

Crop Diversification Index measures the diversity of crops grown in an area, with a higher number indicting a greater diversity of crops. To calculate the crop diversification index, you would need to first determine the total number of crops grown in the area and the number of different types of crops that are grown. Then you would divide the number of crops grown by the total number of crops and multiply the result by 100 to express the result as a percentage
The formula for calculating the crop diversification index is:
Crop Diversification Index = [ (Number of Crops Grown) / (Total Number of Crops) ] x 100
For example, if an area has 10 crops and 5 of those crops are different types, the crop diversification index would be:
(5 crops / 10 crops) x 100 = 50%
This would indicate that the area has a moderate level of crop diversity
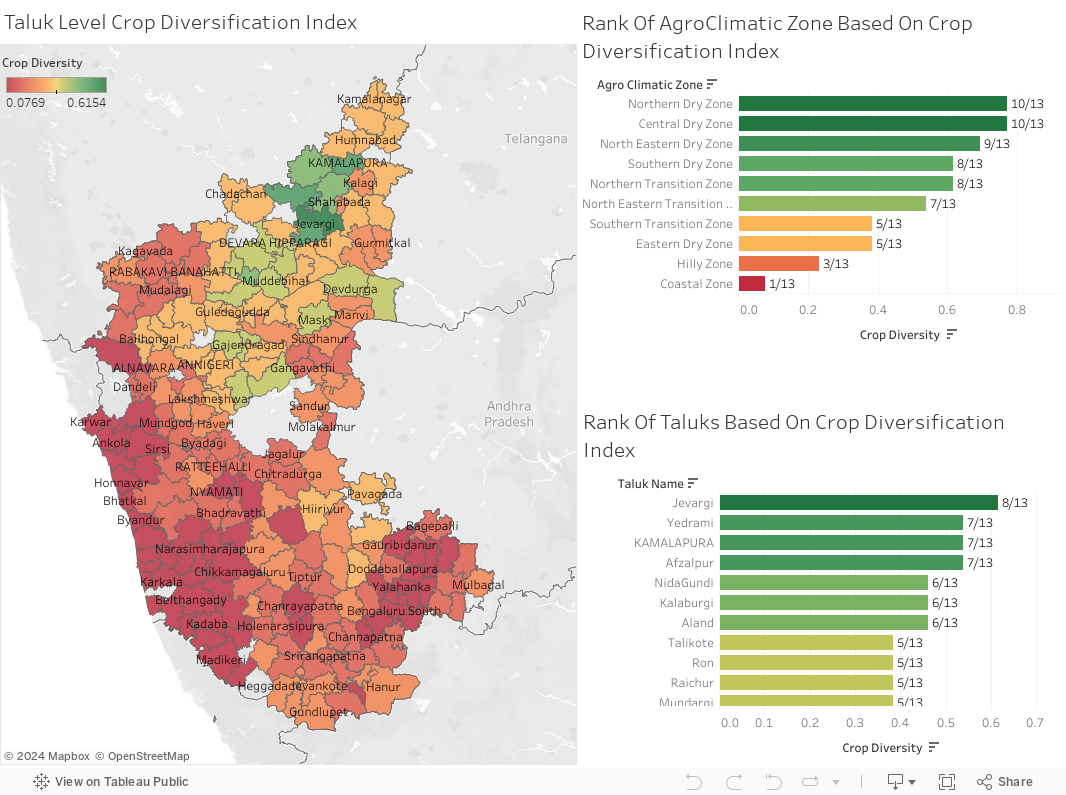
It is found that taluks in the Coastal zone and Hilly zone have the least diversity in terms of cropping pattern whereas taluks in the Northern Dry Zone are showing high diversity in the cropping pattern.