Introduction : Understanding Multi-dimensional poverty Index
Poverty is more than just ‘lack of money’. It has dimensions as no two people experience poverty in the same way.
The 2030 Agenda acknowledges that eradicating poverty in all its forms and dimensions, including extreme poverty, is the greatest global challenge and an indispensable requirement for sustainable development.
But what does it mean to end poverty?
UNDP’s human development approach has long argued that tracking incomes alone is not enough. To understand the lives of the poor, you must go beyond the income measure – $1.90 or $2.15 a day – and ensure the poor have opportunities, choices, and access to the most basic human needs. Increased incomes are only a means to this agenda, not an end.
Since 2010, UNDP has partnered with the Oxford Poverty and Human Development Initiative (OPHI) to present a new international measure of poverty – the Multidimensional Poverty Index or MPI.
What does MPI mean and measure?
MPI looks at how people experience poverty in multiple, overlapping ways.
The Multidimensional Poverty Index identifies acute deprivations in health, education and standard of living by interrogating 10 indicators – nutrition, child mortality, years of schooling, school attendance, access to cooking fuel, sanitation, drinking water, electricity, and housing, and ownership of assets. One is ‘MPI poor’ if they are deprived in three or more weighted indicators.
Factors impacting MPI
For the predictive impact analysis, data for the following factors is taken into account in relation to the 10 indicators of the Multi-dimensional poverty index.
- % count of people deprived Bank account
- % count of people deprived Child Mortality
- % count of people deprived Cooking
- % count of people deprived House Malnutrition
- % Count Of People Deprived Housing
- % count of people deprived Maternal health
- % count of people deprived school Attendance depr
- % Count Of People Deprived Years of schooling depr
- Female Literacy
- Gross Enrolment Ratio (Elementary)
- Gross Enrolment Ratio (Secondary)
- Human Development Index
- Male Literacy
- Maternal Mortality Rate (per 1 lakh)
- Per Capita Income (at constant prices)
- Percentage of households having access to electricity
- Percentage of Households having access to modern cooking fuel
- Percentage of households having access to pucca house
- Percentage of households having access to safe drinking water
- Percentage of households having access to toilet
- Percentage of workers in nonagricultural sector
- Under5 mortality rate (per 1000)
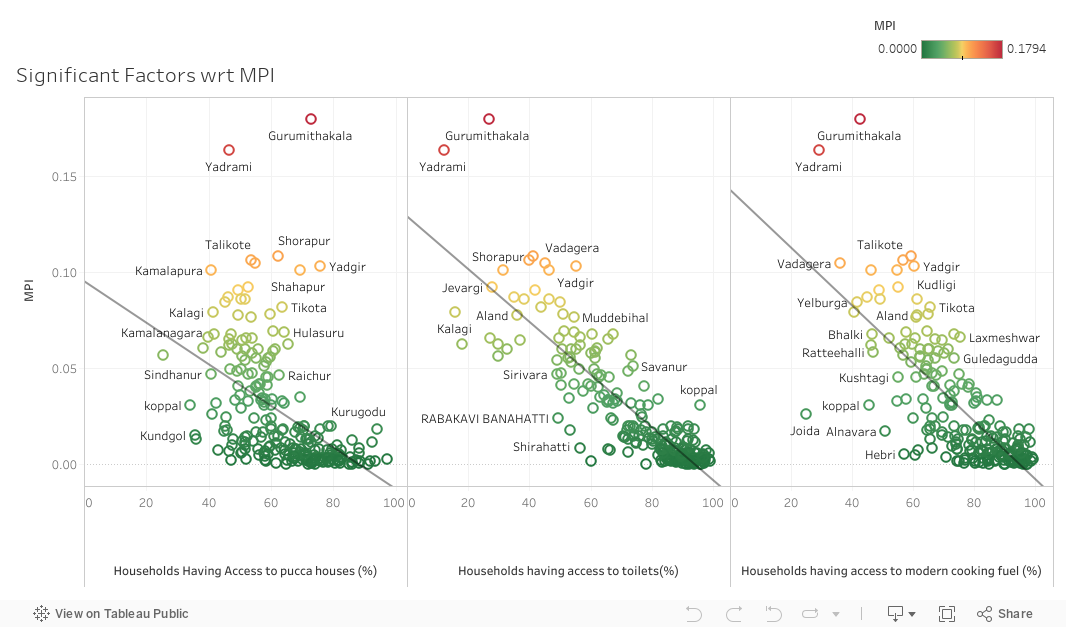
Based on our analysis and consultation with domain experts, the following factors are observed to be impactful for further analysis.
- Households having access to Pucca house (%)
- Households having access to Toilets (%)
- Households having access to modern cooking fuel (%)
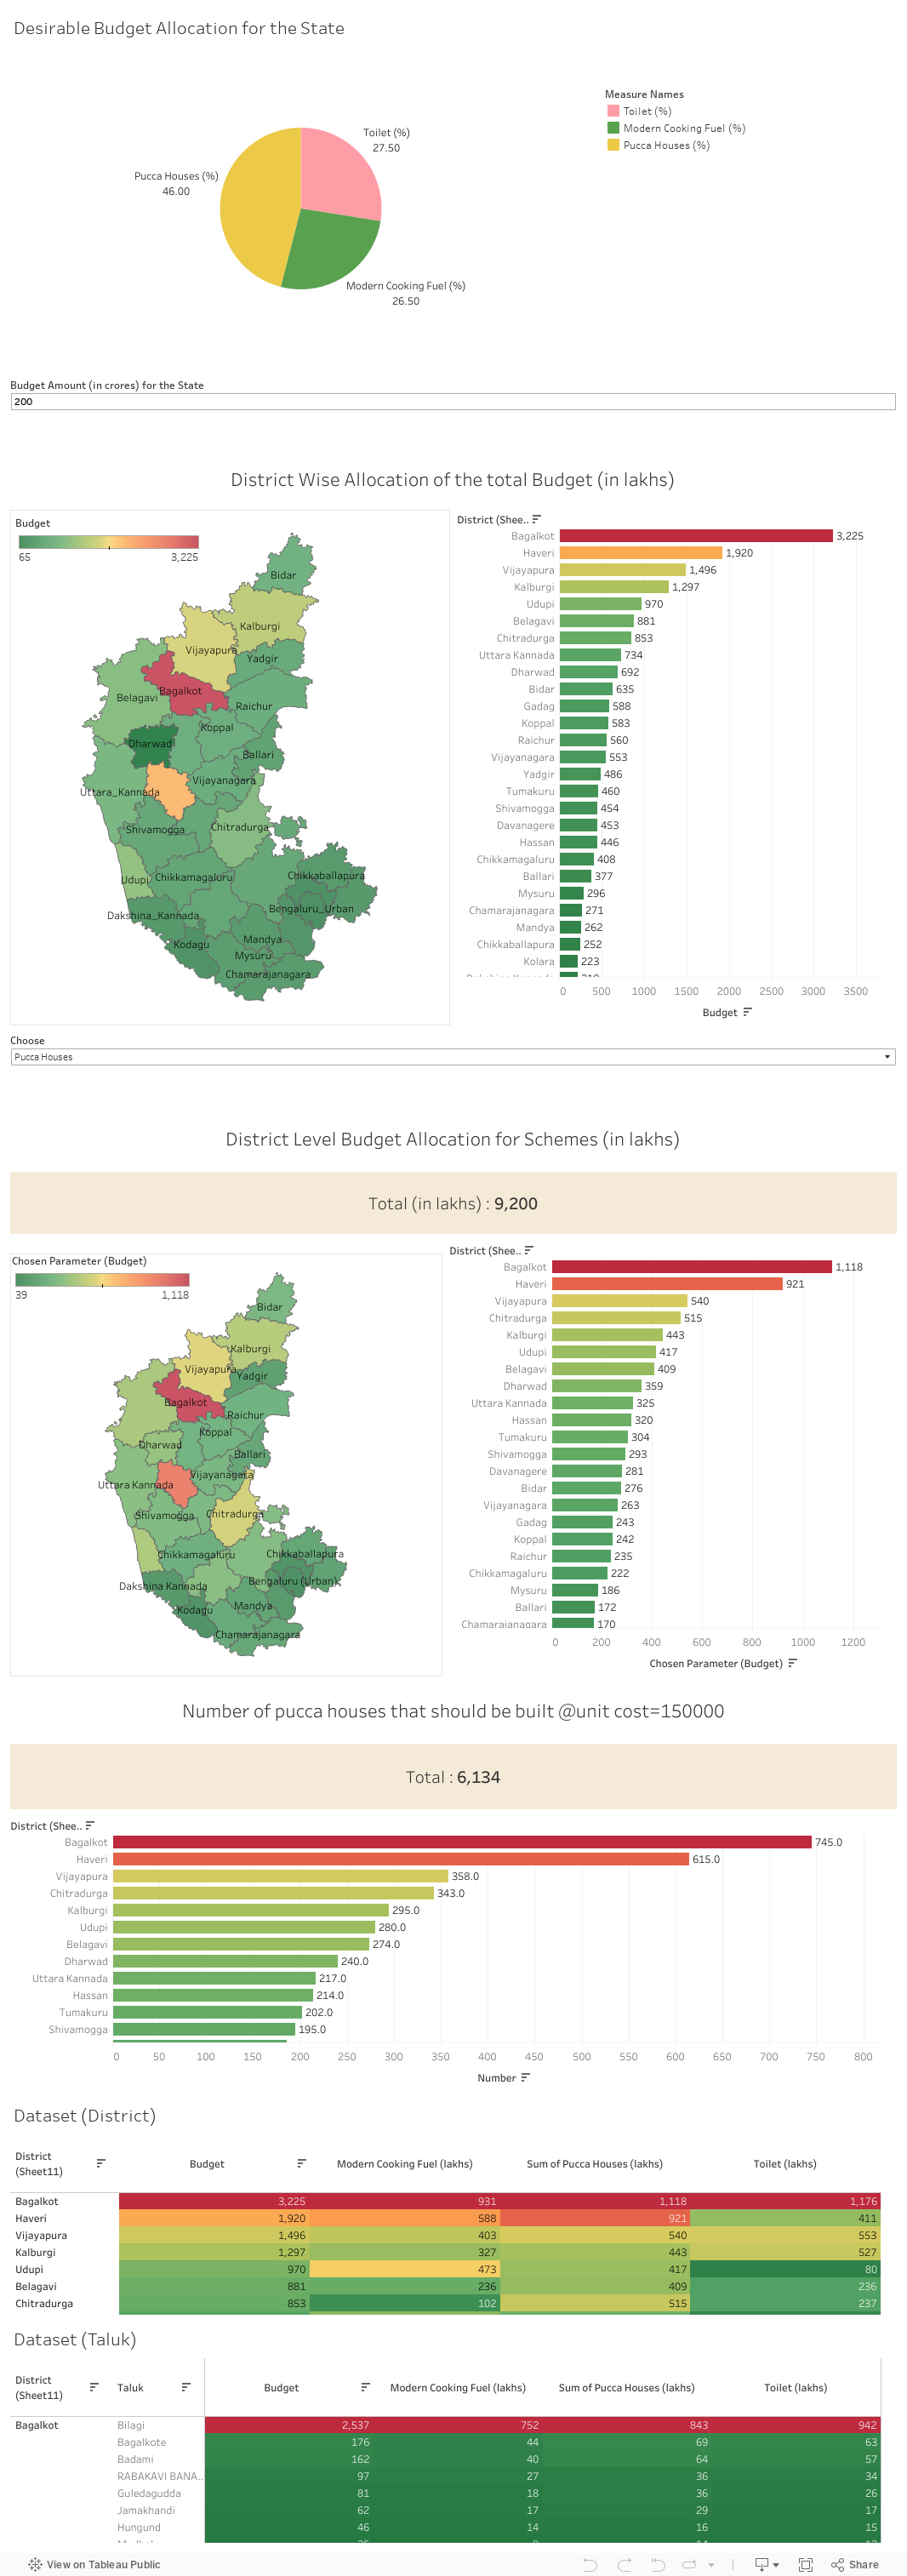
Recommended Budget Allocation For Reducing MPI
The budget allocation is calculated based on the slopes of the various significant factors with respect to MPI. If a factor has high slope with MPI, then that factor has to be allocated more budget than others. The method also takes into account the population of each district/taluk and distributes the budget in such a way that if a particular district/taluk has more people who are affected by a factor x, then we allocate more amount to that district/taluk in order to control that factor.