This data story analyses various factors from multiple sources that are highly correlated with the Secondary Dropout Rate at the taluk level and uses predictive analysis to estimate the impact of changes in each factor on districts and taluks. The interactive dashboards are based on the report “Indicators And Its Impact Across Poverty, Health & Education Sectors“. Please click here to view/download the report.
Secondary Dropout Rate Factors
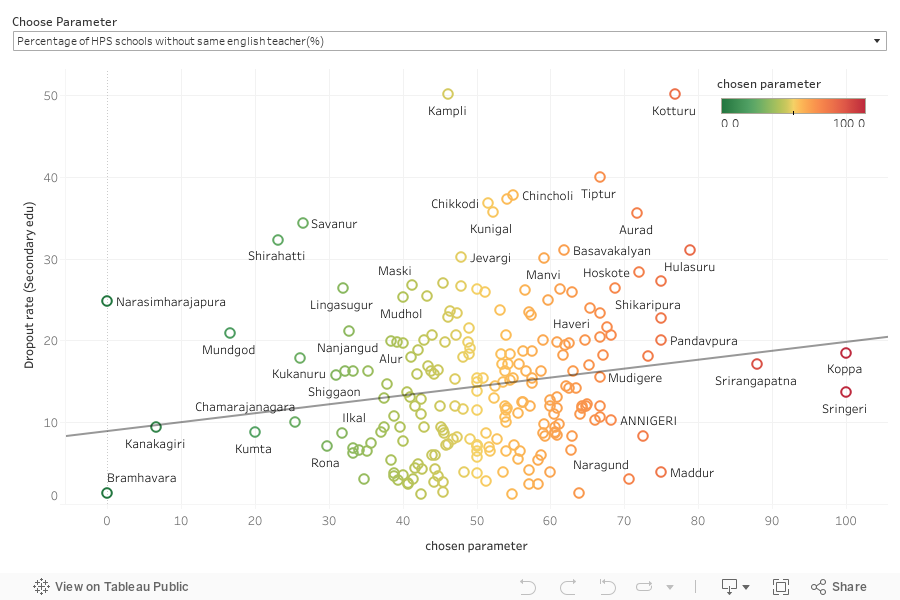
You can select the variable for which you want to see correlation with Secondary Dropout Rate, from the dropdown menu.
If the p-value for a variable is less than 0.05, then that variable has a significant correlation with Secondary Dropout Rate. While many factors have significant correlation to Secondary Dropout Rate, the following have been identified as impact factors in consultation with the domain experts.
Impact Factors
- Percentage of HPS schools without same english teacher(%)
- Percentage of schools without functinal Laptop/Notebook,tablets,desktops or PCs(%)
- Percentage of total teacher trained computer
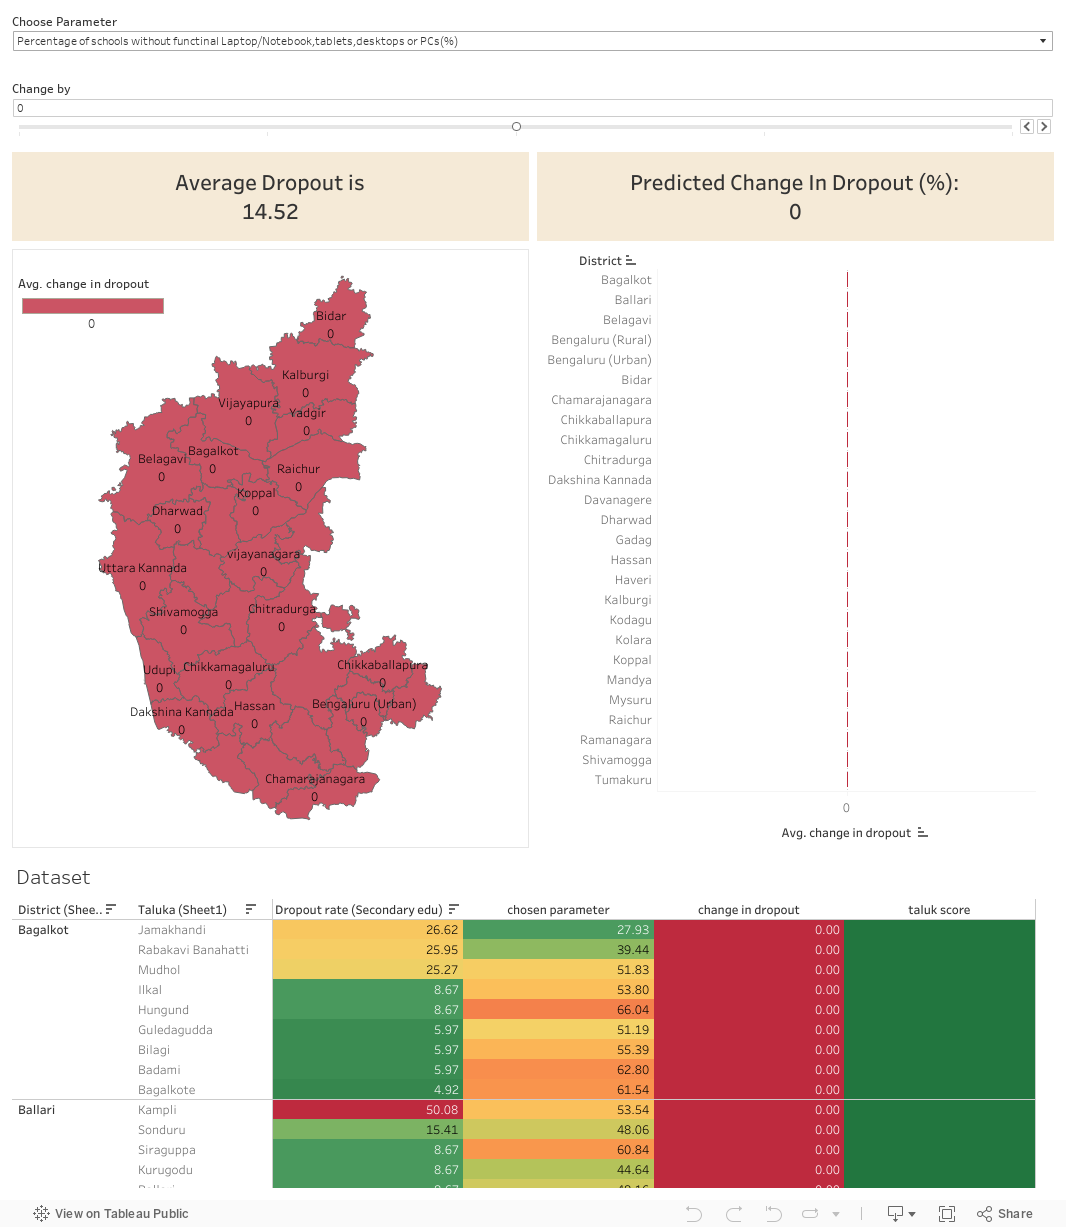
Predictive Impact Analysis
The dashboard has a slider using which, you can change the factor of interest. Initially, the slider is at 0%. If you want to decrease the factor by 10%, you can move the slider to the left. Similarly, if you want to increase the factor by 10%, you can move the slider to the right.
For example, say you want to increase “Percentage of total teacher trained computer” by 20% of the current value, you can do it by moving the slider two times to the right (which corresponds to +20%)
The dashboards has district level map as well as taluk level map. The colours on these maps represent the change in multidimensional poverty index after making the desired change in the factor of interest. If you hover over a particular district in the district level map, you get a magnified image of those taluks belonging to that district.
Below the maps, you can see the score of each taluk sorted in descending order. The scoring is based on how good each taluk has performed in changing yield after changing the factor.
At the very bottom, you can see the dataset that is being used for making this interactive visualization
Recommended Budget Allocation For Reducing Secondary Dropout Rate
The budget allocation is calculated based on the correlation of the various significant factors with Secondary Dropout Rate. If a factor has high correlation with Secondary Dropout Rate, then that factor has to be allocated more budget than others. The method also takes into account the population of each district/taluk and distributes the budget in such a way that if a particular district/taluk has more people who are affected by a factor x, then we allocate more amount to that district/taluk in order to control that factor.
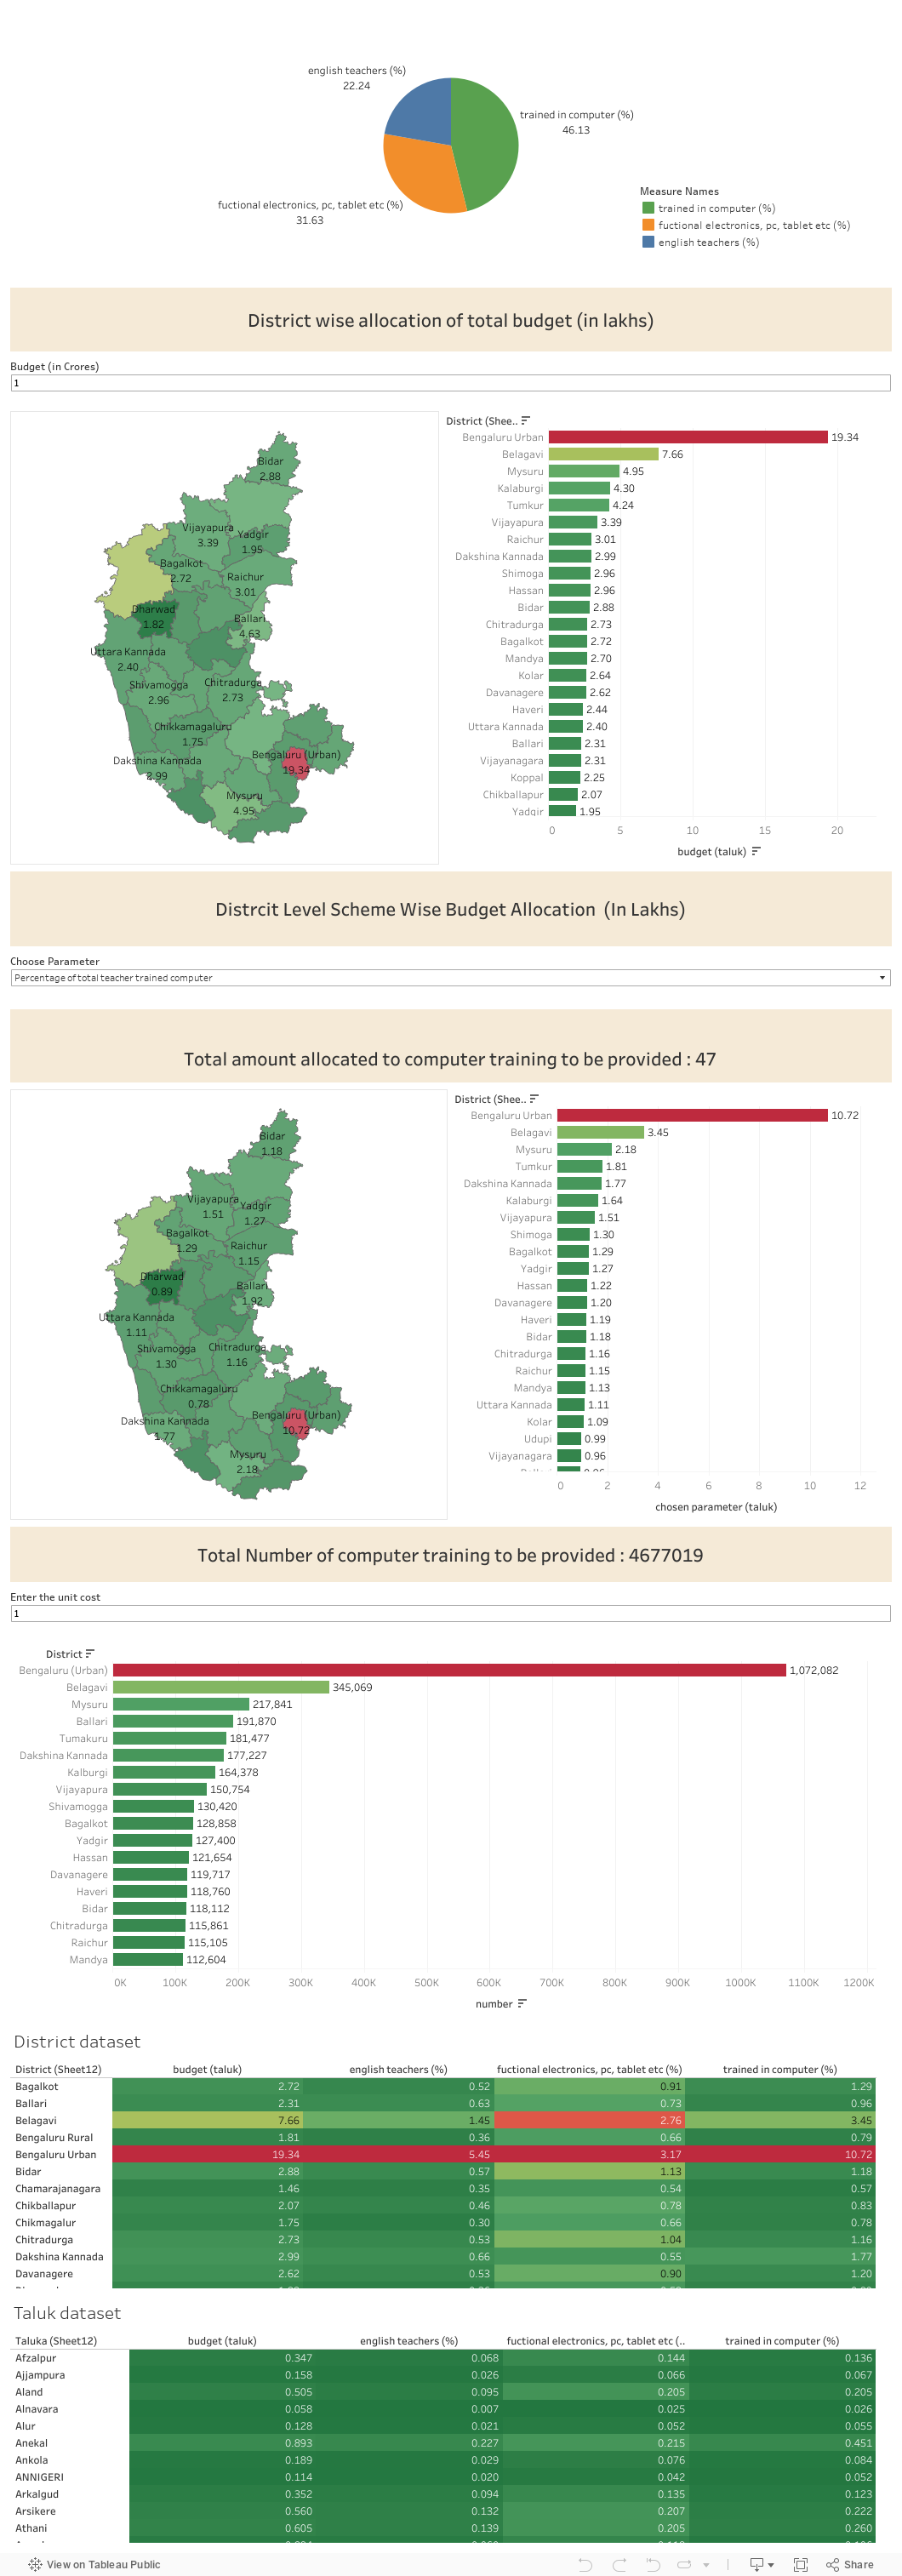
The report Outcome-based SDG budget- Secondary Education outlines the components of the following data story and gives taluka-specific budget recommendations based on outcomes for each relevant factor. Please click here to view/download the report and the dataset.