This data story considers different factors from multiple sources that have a high correlation with Infant Mortality Rates (IMR) across taluks, and builds predictive models of expected impact of changing each factor for each district and taluk. Based on the correlations, the recommended budget allocation for different schemes/factors is also given. At the bottom, you can also see an interactive dashboard where you can perform a particular intervention and see whether it is stable or not.
IMR Factors
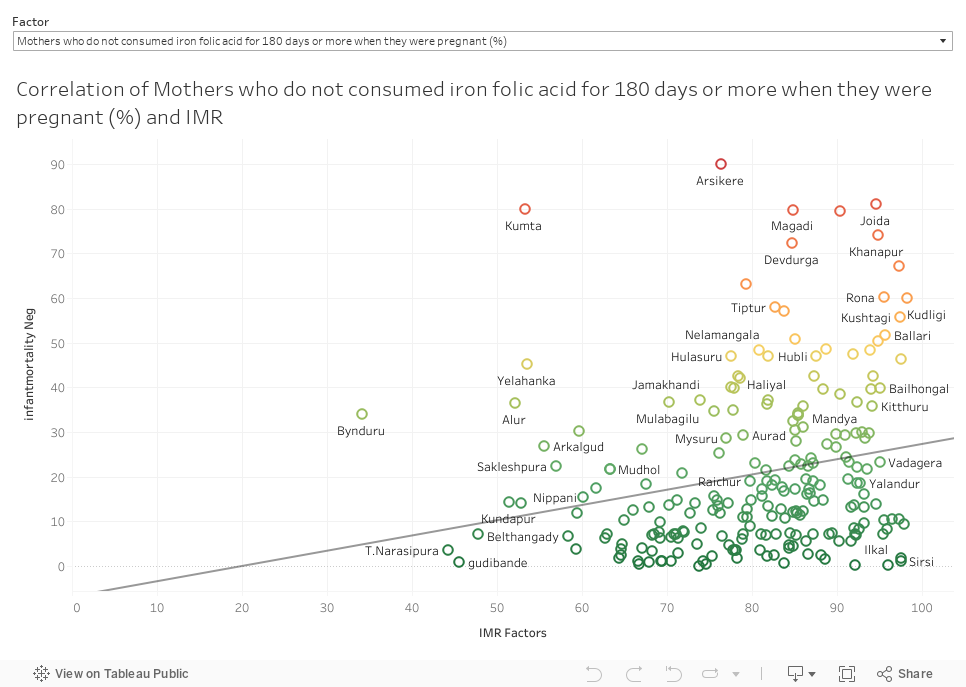
You can select the variable for which you want to see correlation with infant mortality rate, from the dropdown menu.
If p-value for a variable is less than 0.05, then that variable has significant correlation with IMR.
Factors with a significant correlation
- No of Mothers who didn’t have at least 4 antenatal care visits(%) (+ve correlation)
- Deprivation % – Households (Kuchha Houses) (+ve correlation)
- Deprivation % – Households that have no electricity (+ve correlation)
- Deprivation % – Households that cook using solid fuel (+ve correlation)
- Mothers who do not consumed iron folic acid for 180 days or more when they were pregnant (%) (+ve correlation)
- Women age 15-49 years who are anaemic(%) (+ve correlation)
- Children age 6 to 59 months who are underweight or stunted(%) (+ve correlation)
- Deprivation % – Households with Not even one household member has completed six years of schooling. (+ve correlation)
- Children age 9-35 months who do not received a vitamin A dose(%) (+ve correlation)
Relevant Factors without a significant correlation
- Deprivation % – Households with no sanitation facility
- Children who should be breastfed within 1 hour of Birth
- Received Health Insurance (%)
- children low birth weight (%)
- Per Capita Income (at constant prices)
- Number of Asha Working Per 1000 Population
- Number of Chief Health Officers per 1000 population
- Households which do not own more than one asset (radio, TV, telephone, computer, animal cart, bicycle, motocycle etc) (%)
- Gap in number of Primary Health Care
- Gap in number of Community Health Centre
- Children who did not receive postnatal care from a doctor/nurse/Lady Health Visitor/Auxiliary Nurse and Midwife/other health personnel within 2 days of delivery
- Women (15-49 yrs) whose Body Mass Index (BMI) is below normal (BMI <18.5 kg/m2)
- Women aged 20-24 who were married under age 18 yrs
- Deprivation % – Households with no safe drinking water or 30 min away
- Prevalence of diarrhoea under 5 years of age (%)
- Children age 6-23 who should receive adequate diet
- Multidimensional Poverty Index (%)
- Gap in Primary Health Care Doctors
- Gap in number of Community Health Care Doctor
- Births to be attended by skilled health personnel
There are some variables which are significant but not yet included in the predictive impact analysis or budget calculation due to various reasons. For example, ‘households which do not own more than one asset’ is significant, but not included in further analysis as there is only a less chance that this variable has a causal relationship with IMR. The variable ‘Prevalence of Diarrhoea under 5 years’ is also significant but not included in further analysis as IMR is concerned with the death of children below one year. Multidimensional poverty index (MPI) is significant but not included in predictive impact analysis or budget calculation as there are other variables like ‘households with no electricity’ , ‘ households with not even one member completed 6 year of schooling’ etc which are already a part of the analysis. We calculate MPI from these other variables. So including MPI in the coming analysis will be repetitive and not very useful.
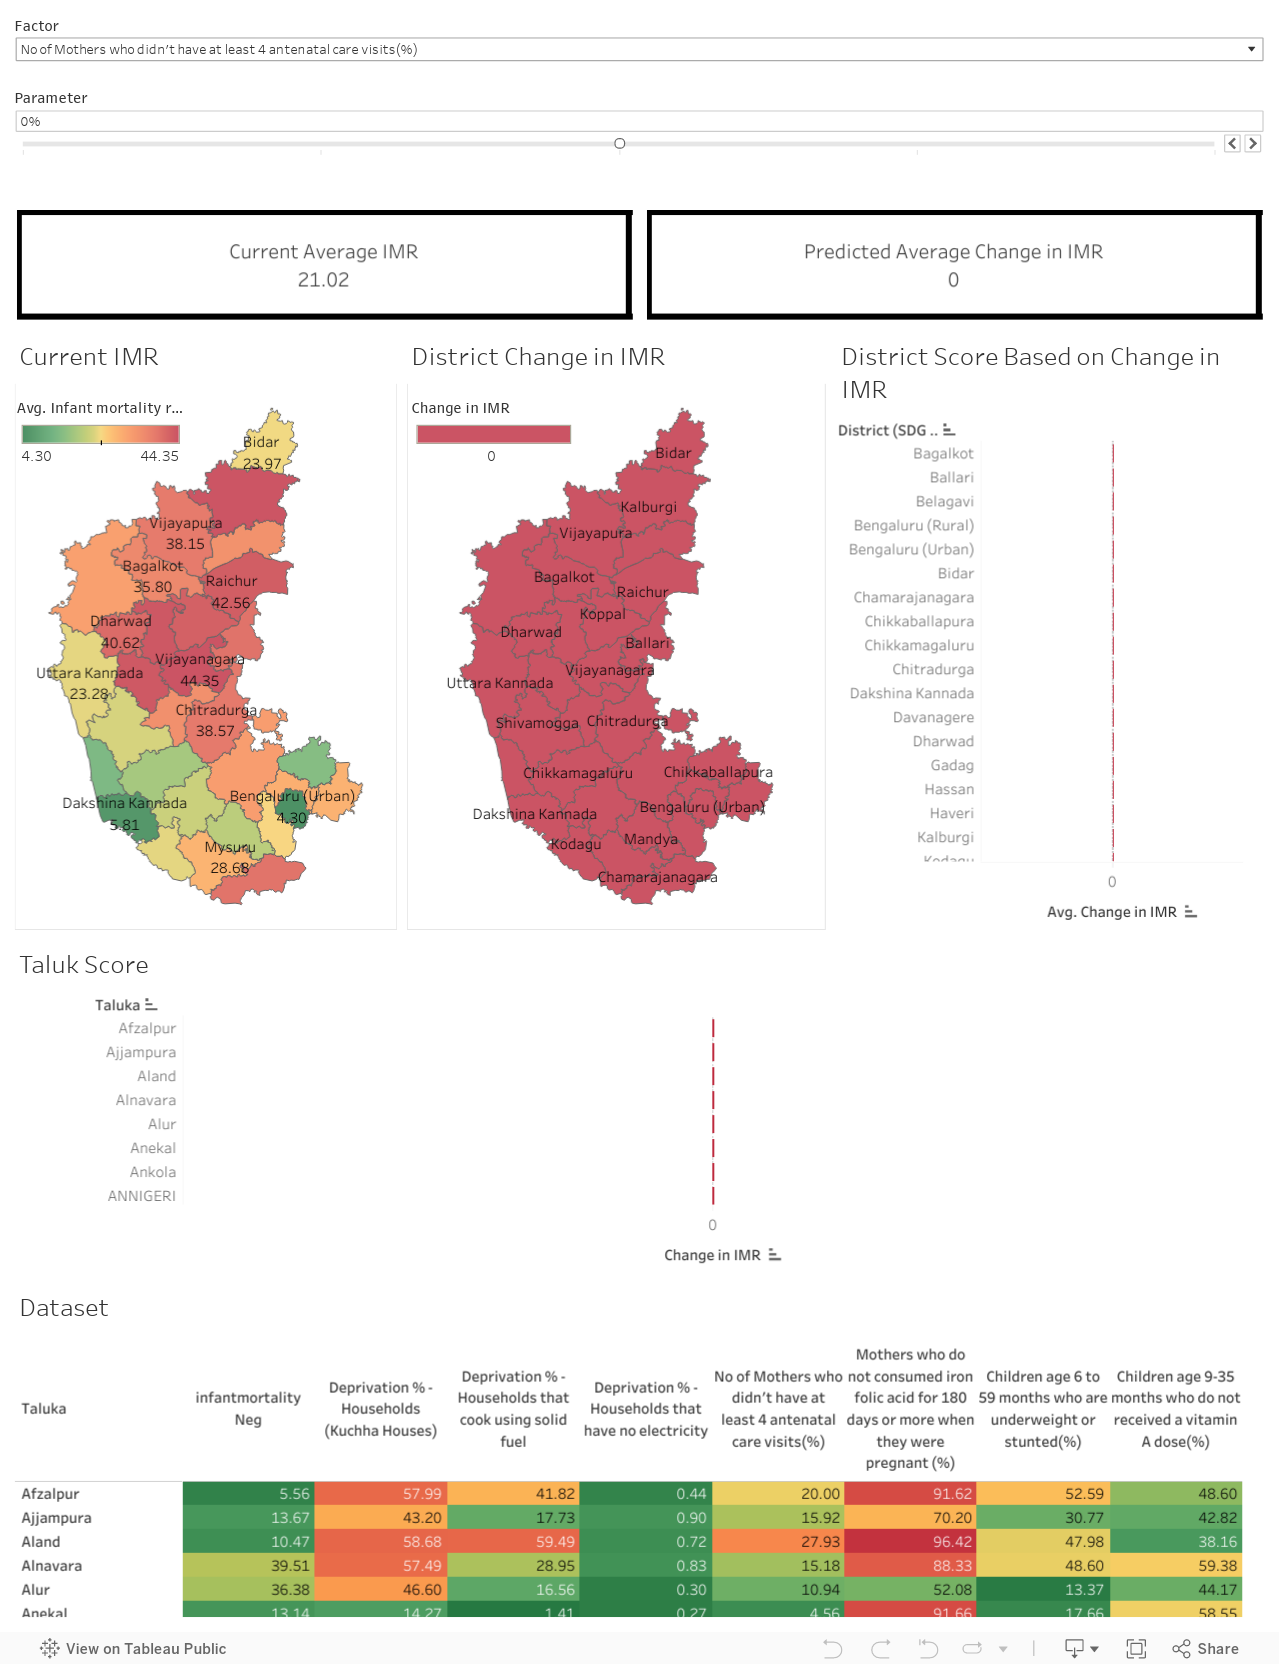
Predictive Impact Analysis
The dashboard has a slider using which, you can change the factor of interest. Initially, the slider is at 0%. If you want to decrease the factor by 10%, you can move the slider to the left. Similarly, if you want to increase the factor by 10%, you can move the slider to the right.
For example, say you want to decrease the percentage of anaemic women aged 15-49 by 20% of the current value, you can do it by moving the slider two times to the left (which corresponds to -20%)
The dashboards has district level map as well as taluk level map. The colours on these maps represent the change in infant mortality after making the desired change in the factor of interest. If you click on a particular district in the district level map, you get a magnified image of those taluks belonging to the selected district.
Below the maps, you can see the score of each taluk sorted in descending order. The scoring is based on how good each taluk has performed in changing yield after changing the factor.
At the very bottom, you can see the dataset that is being used for making this interactive visualization
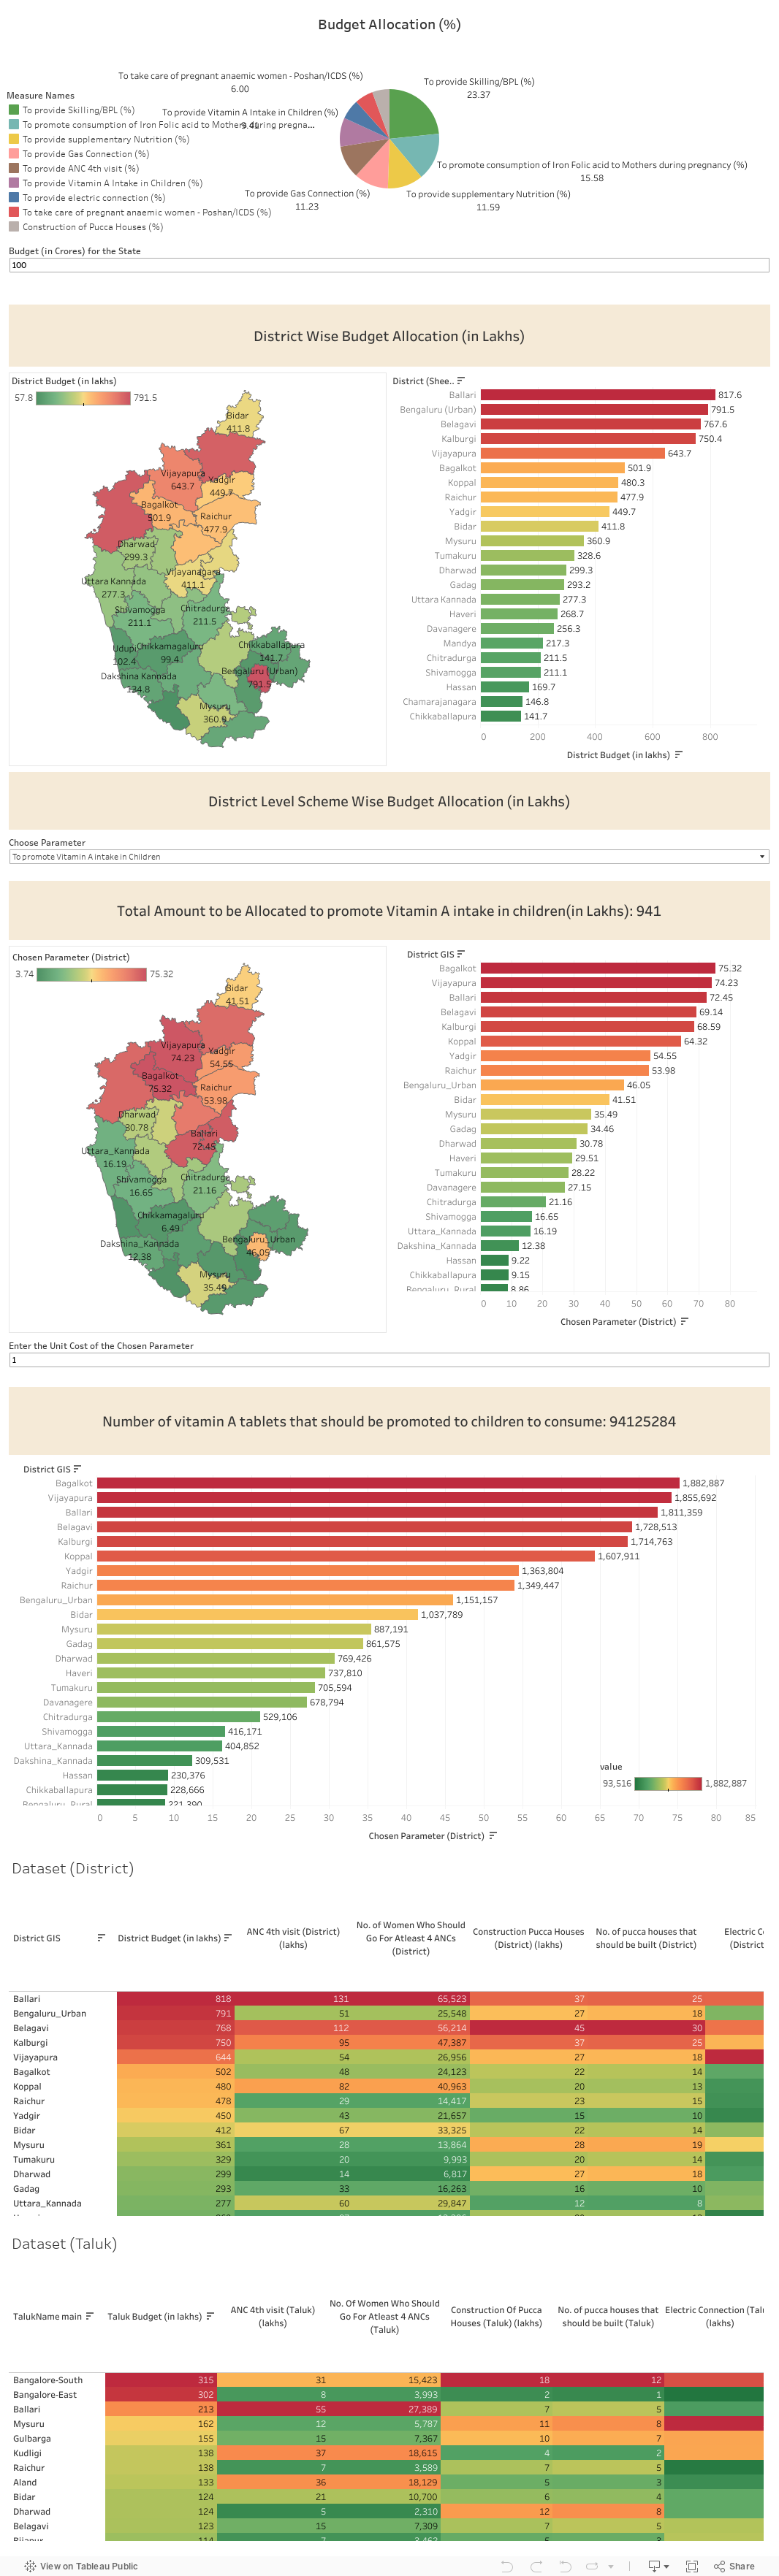
Recommended Budget Allocation For Reducing IMR
The budget allocation is calculated based on the correlation of the various significant factors with IMR. If a factor has high correlation with IMR, then that factor has to be allocated more budget than others. The method also takes into account the population of each district/taluk and distributes the budget in such a way that if a particular district/taluk has more people who are affected by a factor x, then we allocate more amount to that district/taluk in order to control that factor.
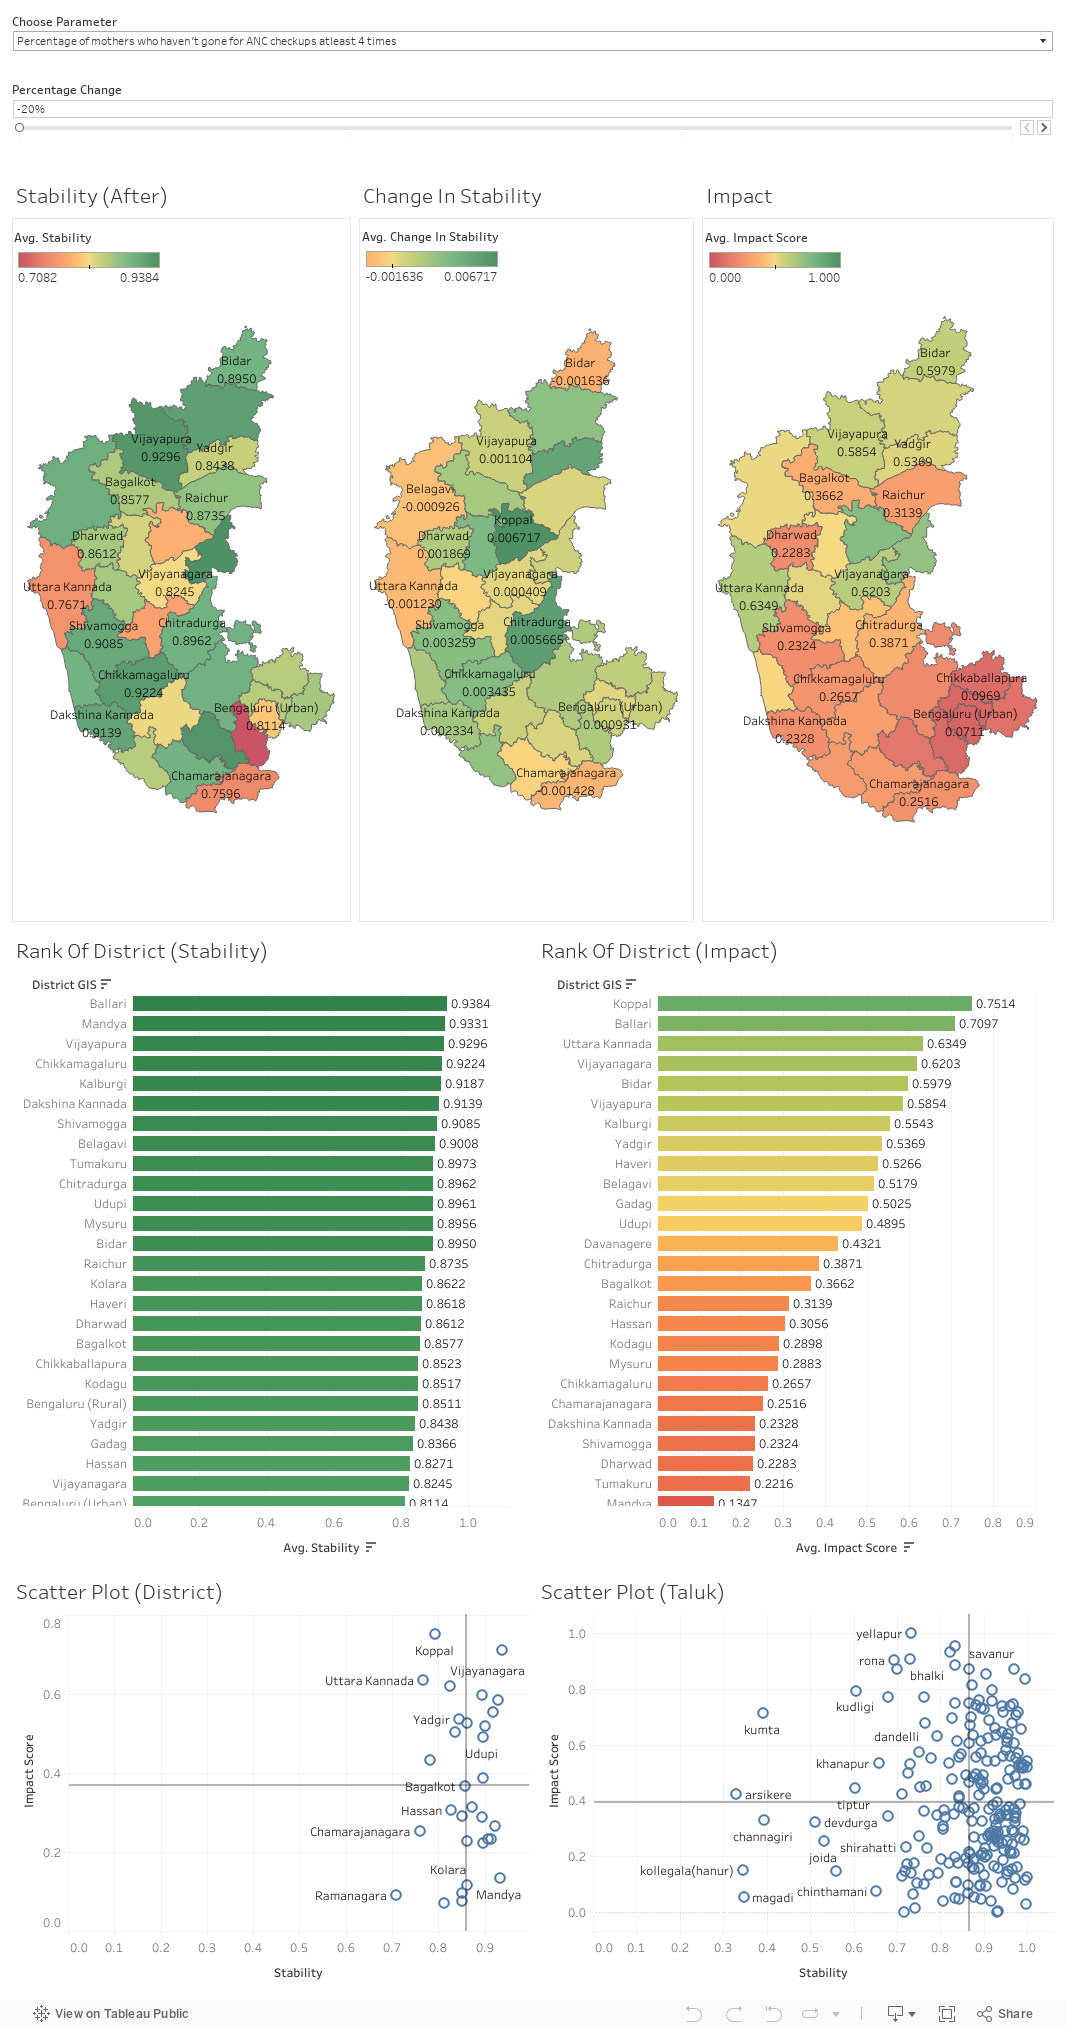
Stability Modelling
Stability modelling addresses the question of disparity in outcomes in response to an intervention at the taluk level. If an intervention resulted in vastly different outcomes between a taluk and its neighbourhood, such an outcome is likely to be less sustainable.
Stability scores are normalized between 0 to 1 and shown at both a taluk level and district level aggregation. In the scatter plot below, points in the top-right quadrant represent regions which show high impact and high stability in response to an intervention.
You can select the variable you want to intervene from the dropdown menu given at the top. Below the dropdown menu, a slider is provided using which you can change the selected variable and see the corresponding impact and stress scores at a district level as well as taluk level.
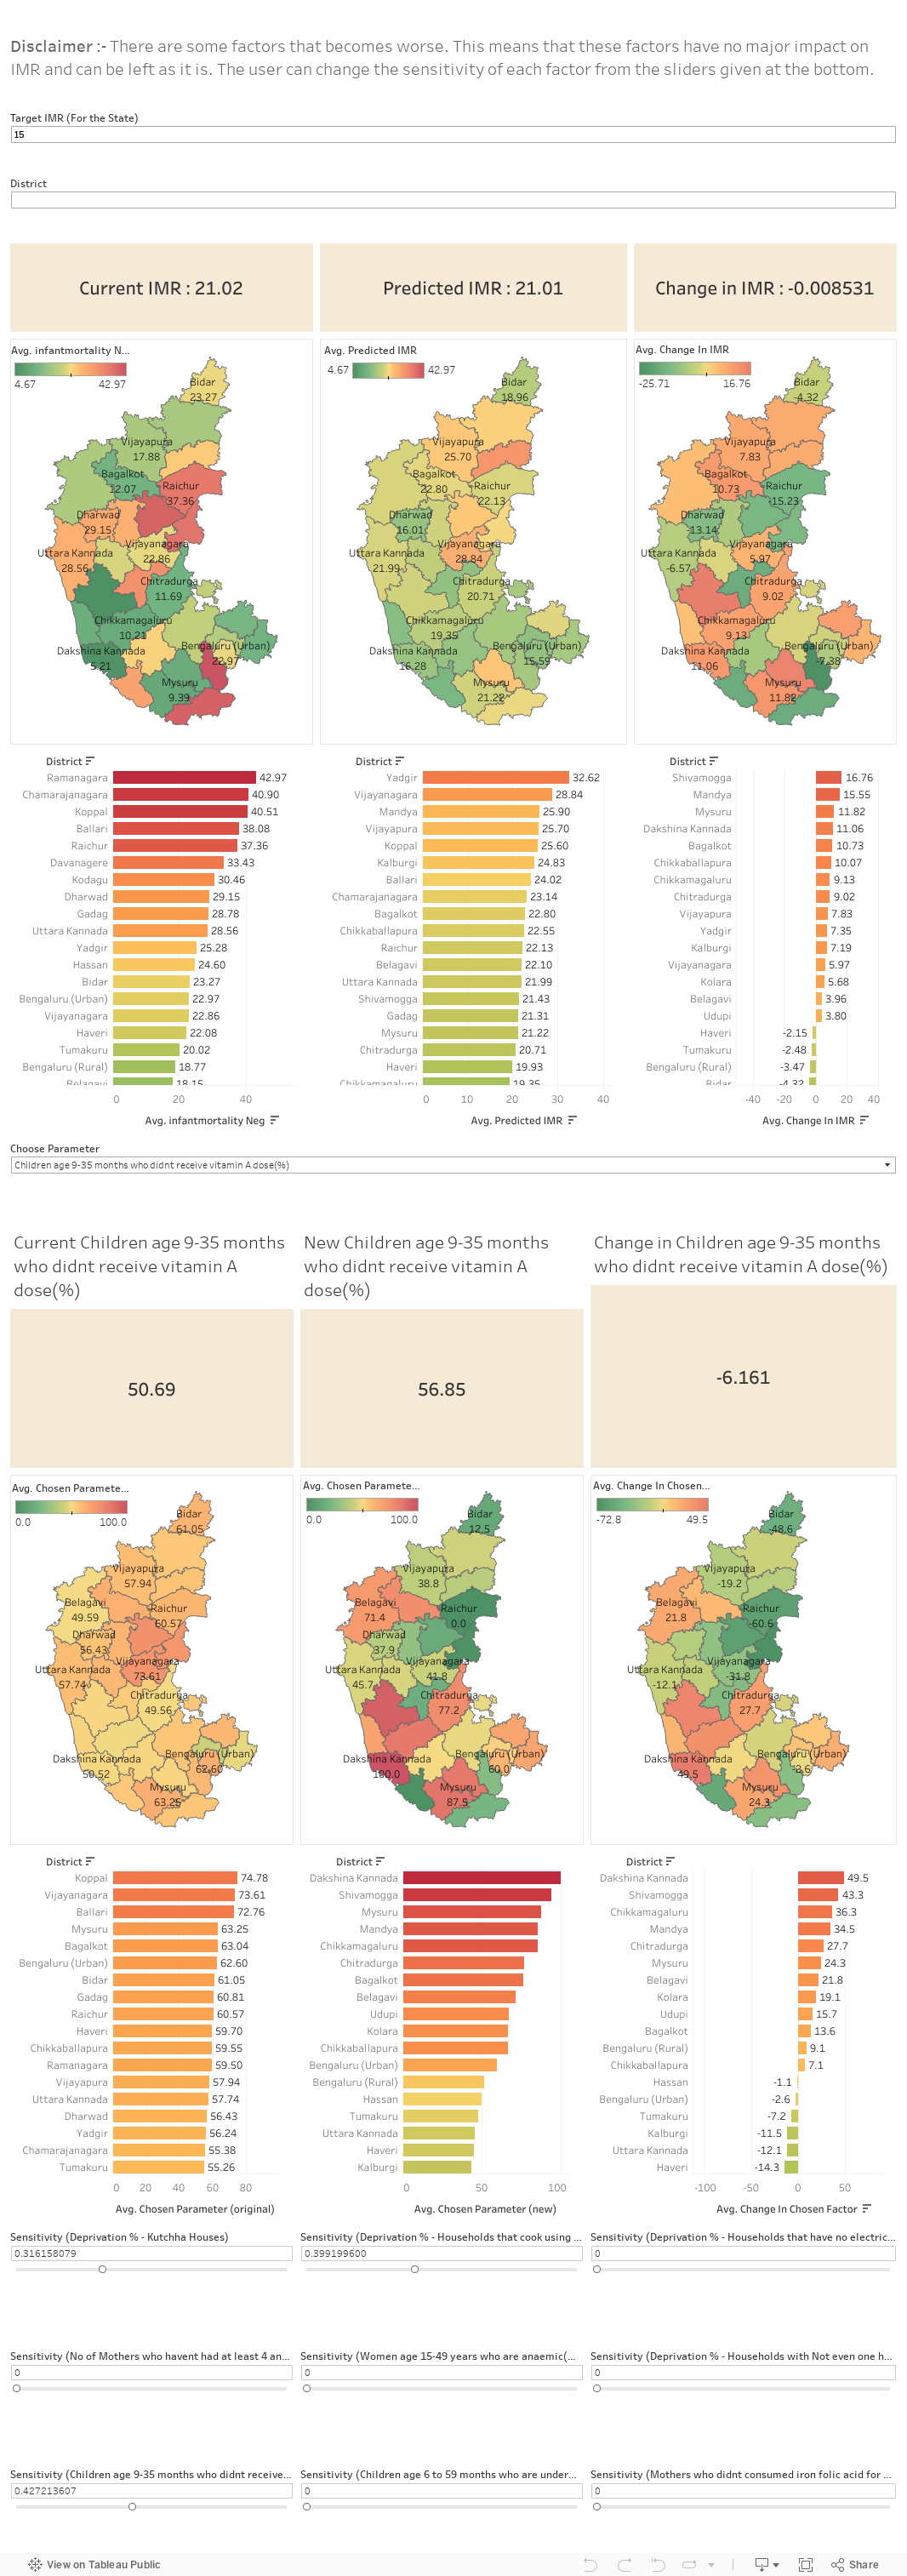
Prescriptive Modelling – IMR
The below dashboard shows how the indicators has to progress in order to achieve a target value for IMR, which can be specified in the field ‘Target IMR (for the state)’. The user can change sensitivity of each factor using the sliders given at the bottom.