BPL Factors
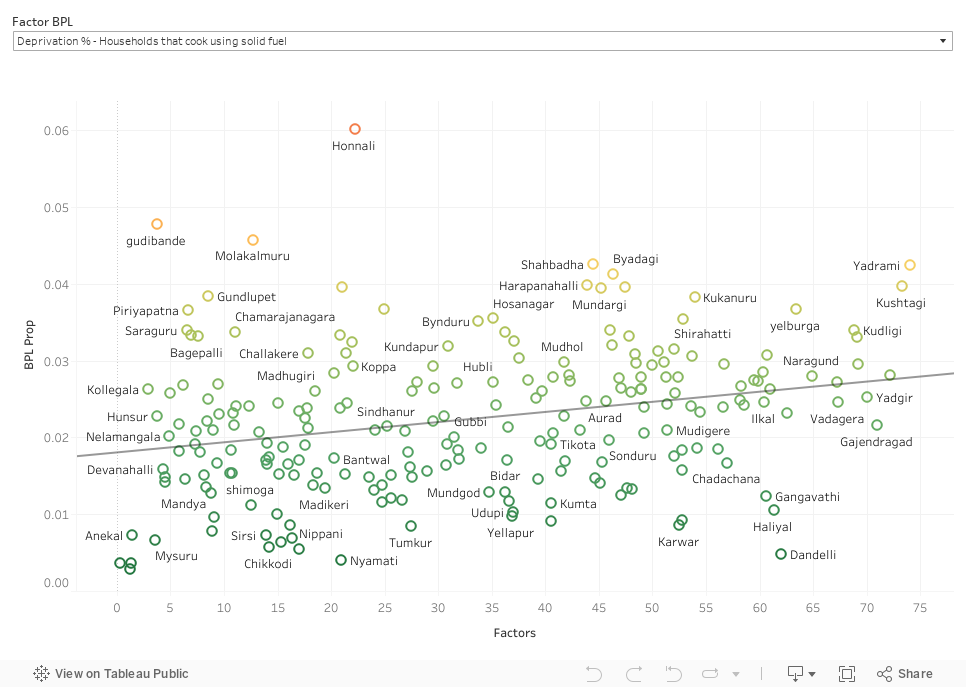
You can select the variable for which you want to see correlation with BPL proportion, from the dropdown menu.
If p-value for a variable is less than 0.05, then that variable has significant correlation with BPL proportion.
Factors with significant correlation
- Deprivation % – Households that have inadequate housing material in either floor, roof wall (+ve correlation)
- Deprivation % – Households with Not even one household member has completed six years of schooling. (+ve correlation)
- Deprivation % – Households with no sanitation facility (+ve correlation)
- Deprivation % – Households with adult between 15-49 whose BMI is below normal or children under 5 years who are stunted or wasted (+ve correlation)
Relevant Factors without a significant correlation
- Deprivation % – No household member has a bank account or a post office account.
- Deprivation % – Households that cook using solid fuel
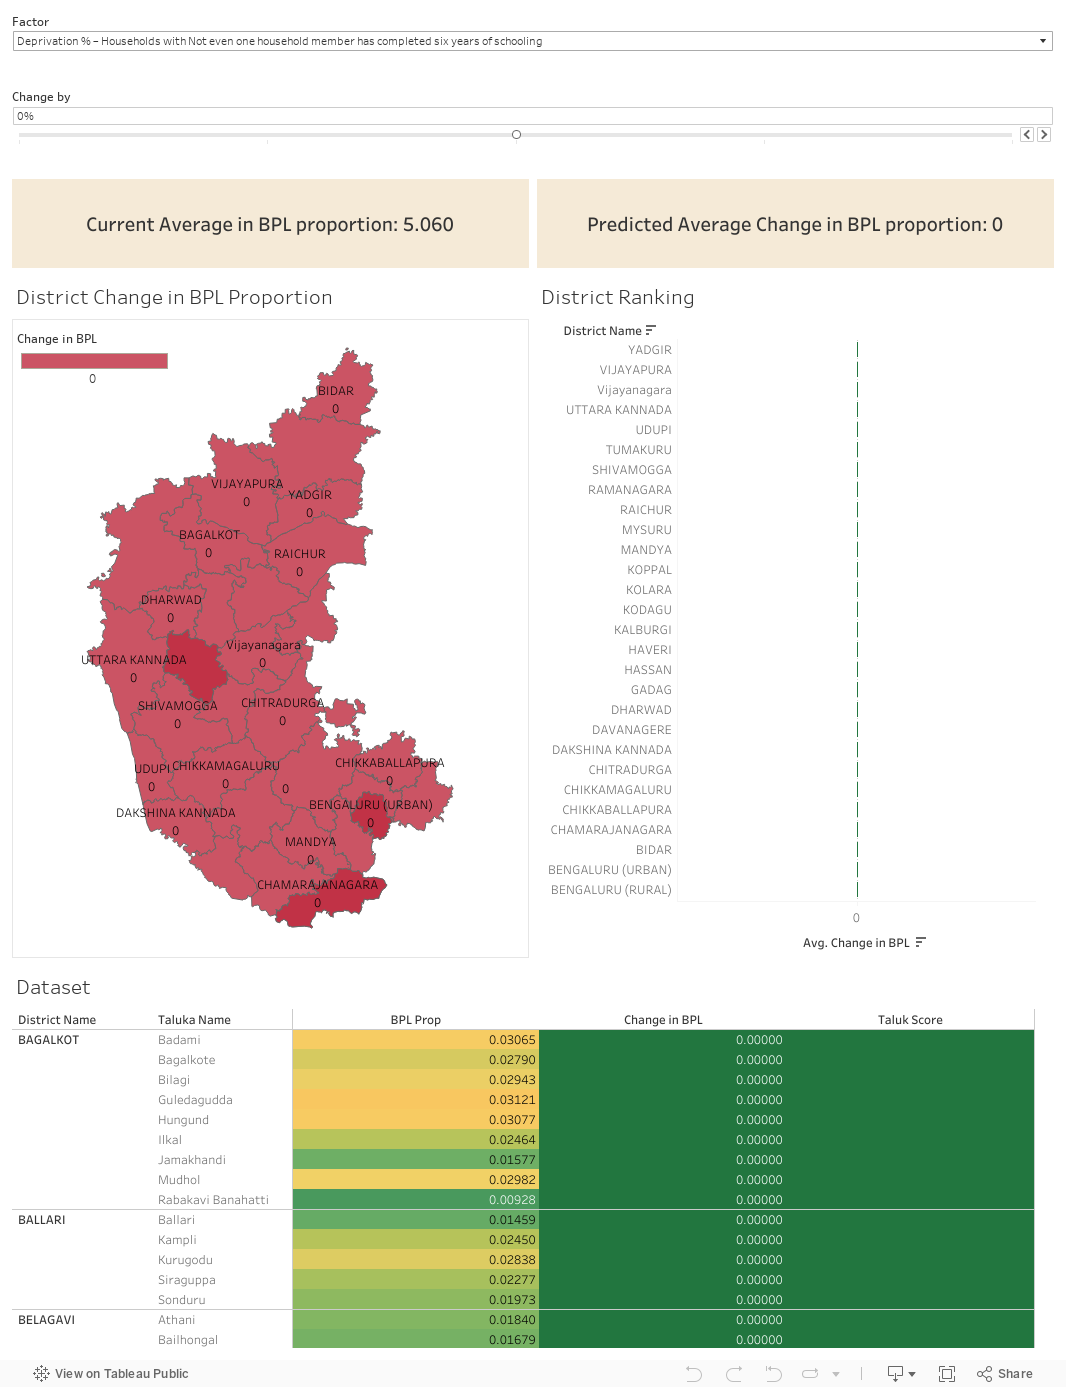
Predictive Impact Analysis
The dashboard has a slider using which, you can change the factor of interest. Initially, the slider is at 0%. If you want to decrease the factor by 10%, you can move the slider to the left. Similarly, if you want to increase the factor by 10%, you can move the slider to the right.
For example, say you want to decrease the percentage of BPL proportion by 20% of the current value, you can do it by moving the slider two times to the left (which corresponds to -20%)
The dashboards has district level map as well as taluk level map. The colors on these maps represent the change in BPL proportion after making the desired change in the factor of interest. If you click on a particular district in the district level map, you get a magnified image of those taluks belonging to the selected district.
Below the maps, you can see the score of each taluk sorted in descending order. The scoring is based on how good each taluk has performed in changing yield after changing the factor.
At the very bottom, you can see the dataset that is being used for making this interactive visualization
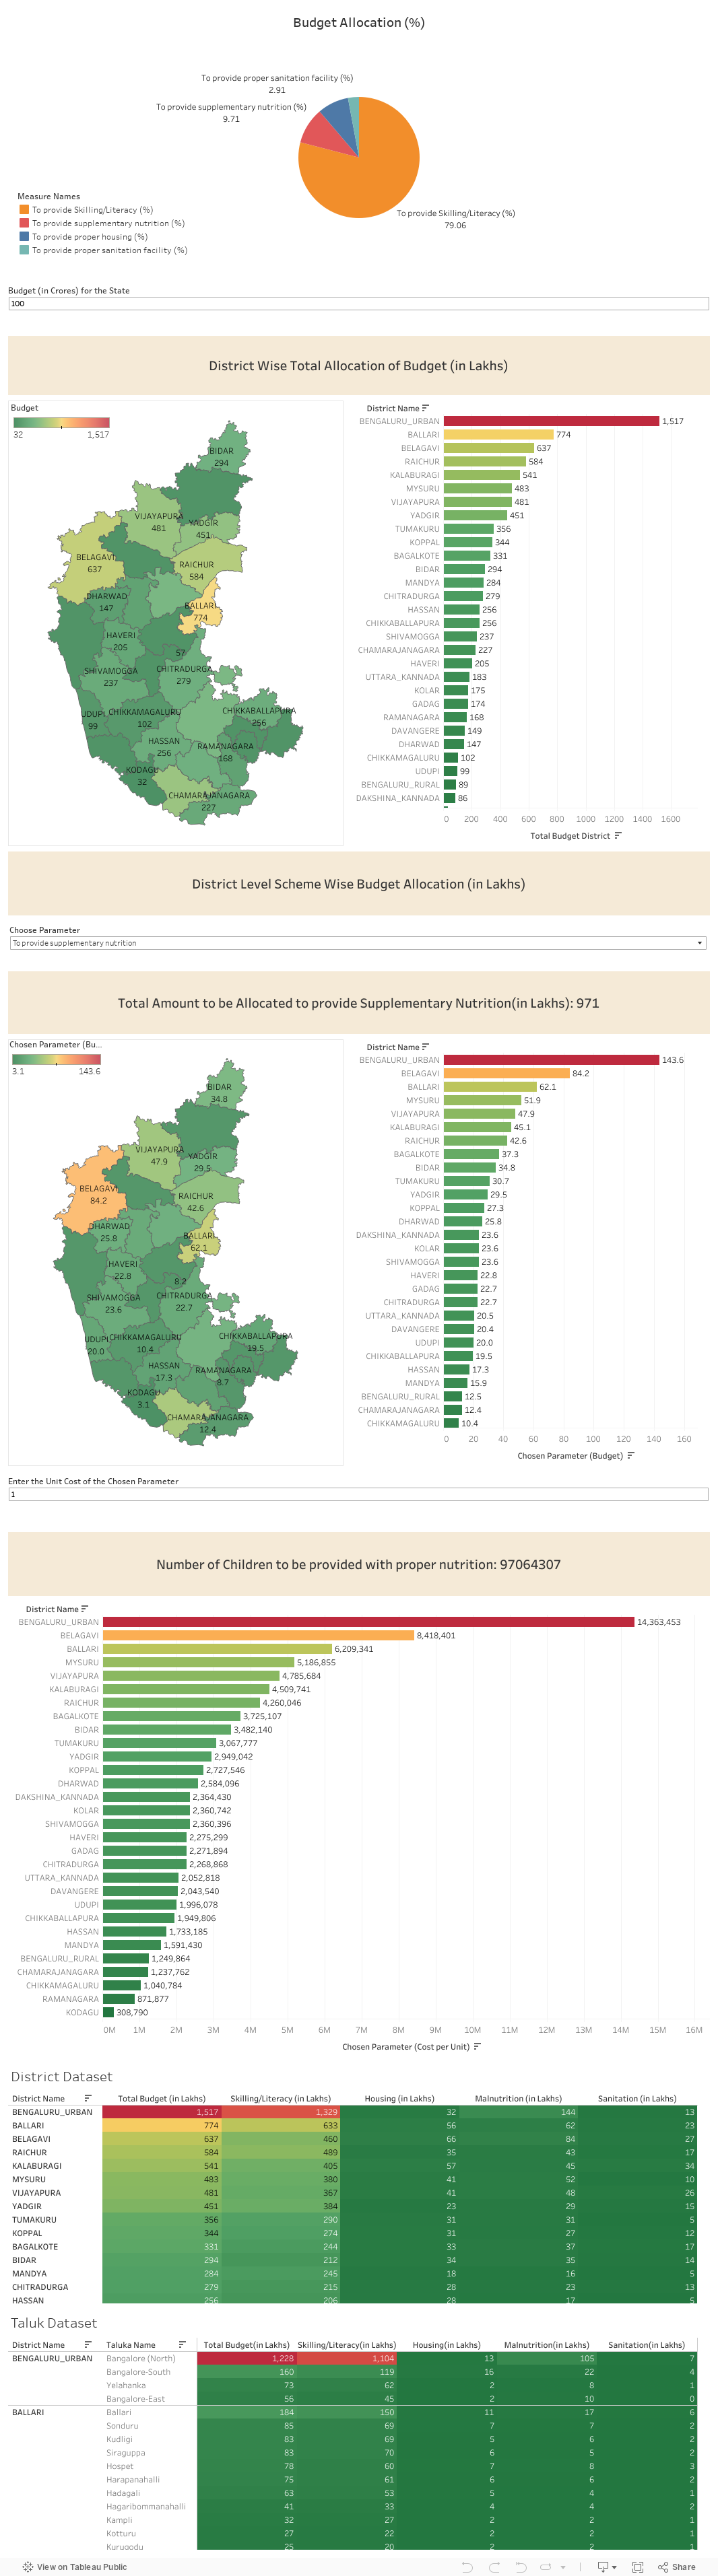
Recommended Budget Allocation For Reducing BPL proportion
The budget allocation is calculated based on the correlation of the various significant factors with BPL proportion. If a factor has high correlation with BPL proportion, then that factor has to be allocated more budget than others. The method also takes into account the population of each district/taluk and distributes the budget in such a way that if a particular district/taluk has more people who are affected by a factor x, then we allocate more amount to that district/taluk in order to control that factor.