This data story analyzes various factors from multiple sources that are highly correlated with the Adolescent Anaemic Girls at the taluk level and uses predictive analysis to estimate the impact of changes in each factor on districts and taluks. The interactive dashboards are based on the report “Indicators And Its Impact Across Poverty, Health & Education Sectors“. Please click here to view/download the report.
The report Outcome-based SDG budget- Health and Nutrition outline the components of the following data story and gives taluka-specific budget recommendations based on outcomes for each relevant factor. Please click here to view/download the report and the dataset.
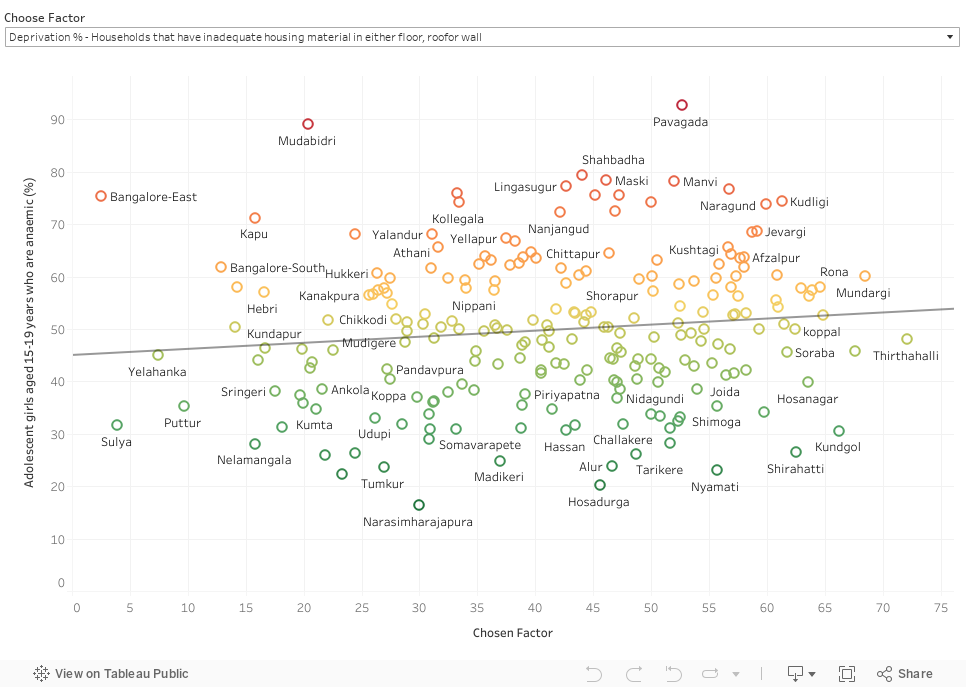
Adolescent Anaemic Girls: Factor-wise correlations
Factors with significant correlation
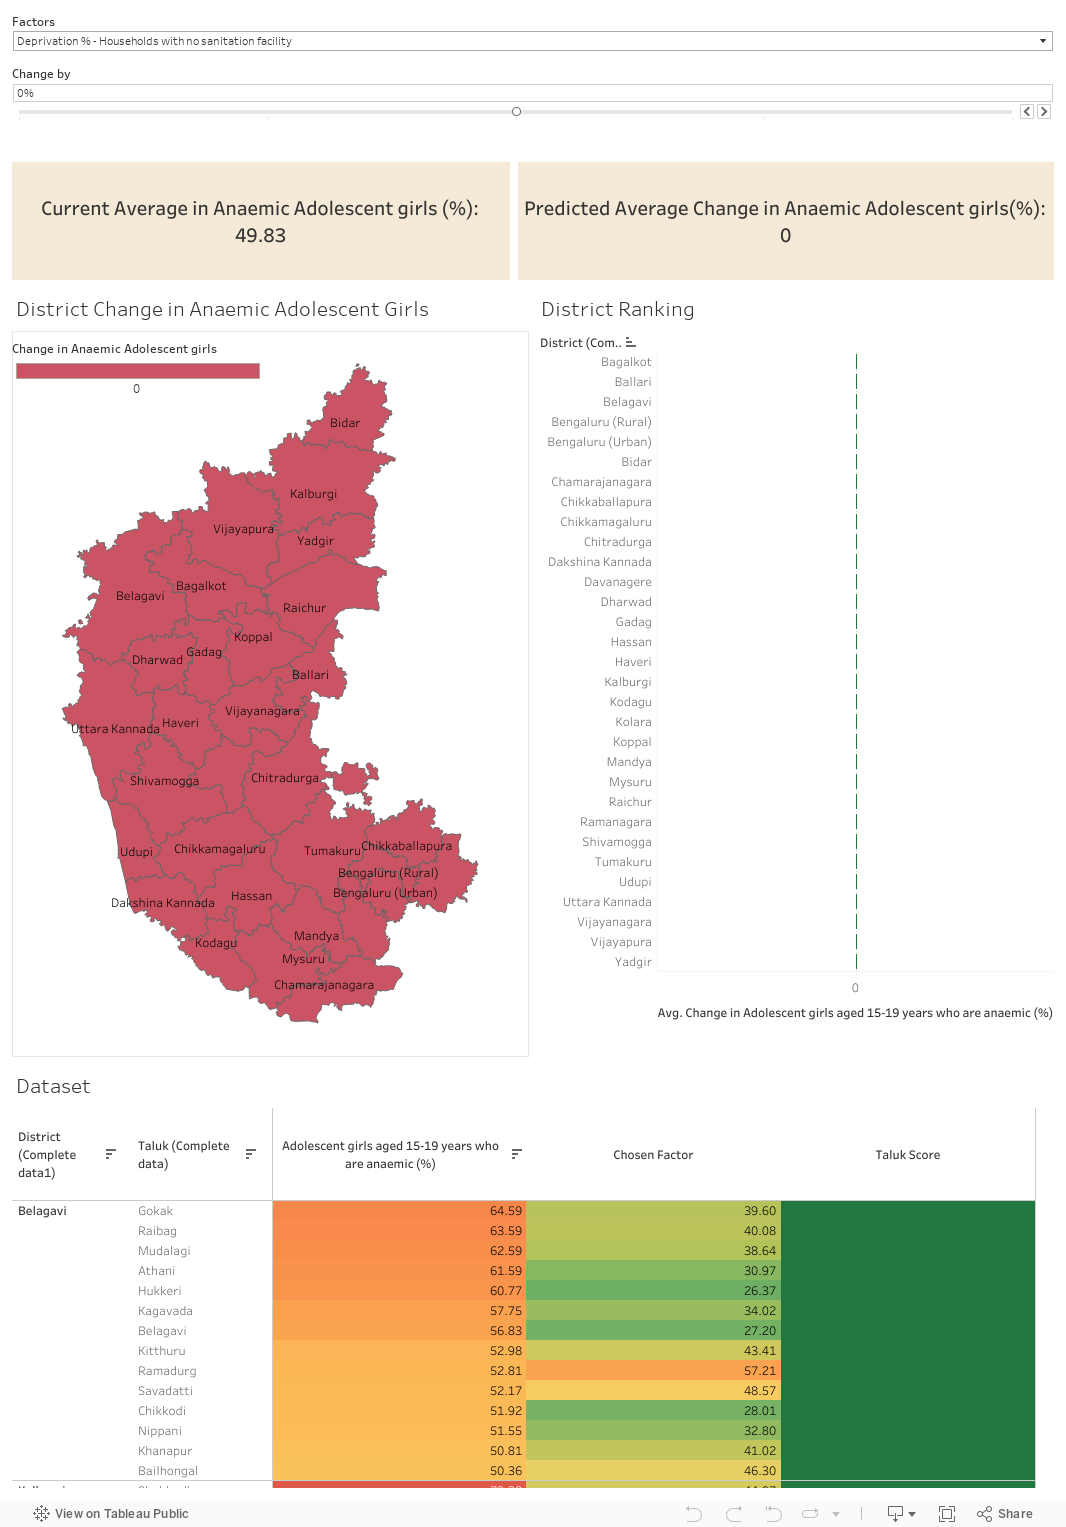
- Deprivation % – Households with no sanitation facility
- Deprivation % – Households that cook using solid fuel
- Deprivation % – Households that have inadequate housing material in either floor, roofor wall
- Received Health Insurance (%) (-ve correlation)
- Gap in number of Primary Health Care
- Gap in Primary Health Care Labtech
- Gap in Primary Health Care Pharmacist
- Children age 12-23 months fully vaccinated based(%) (-ve correlation)
- Severe Acute Malnutrition (+ve correlation)
- Mothers who do not consume iron folic acid for 180 days or more when they were pregnant (+ve correlation)
- %Children age 6-59 months who are anaemic (%) (+ve correlation)
- Deprivation % – Households with adult between 15-49 whose BMI is below normal or children under 5 years who are stunted or wasted (+ve correlation)
- Deprivation % – Households with Not even one household member has completed six years of schooling. (+ve correlation)
- Moderate Acute Malnutrition (+ve correlation)
Factors without significant correlation
- Number of Asha Working Per 1000 Population
- Children age 9-35 months who received a vitamin A dose(%)
Predictive Impact Analysis
The dashboard has a slider using which, you can change the factor of interest. Initially, the slider is at 0%. If you want to decrease the factor by 10%, you can move the slider to the left. Similarly, if you want to increase the factor by 10%, you can move the slider to the right.
For example, say you want to decrease the percentage of anemic children by 20% of the current value, you can do it by moving the slider two times to the left (which corresponds to -20%)
The dashboards has district level map as well as taluk level map. The colours on these maps represent the change in anaemia after making the desired change in the factor of interest. If you click on a particular district in the district level map, you get a magnified image of those taluks belonging to the selected district.
Below the maps, you can see the score of each taluk sorted in descending order. The scoring is based on how good each taluk has performed in changing yield after changing the factor.
At the very bottom, you can see the dataset that is being used for making this interactive visualization.
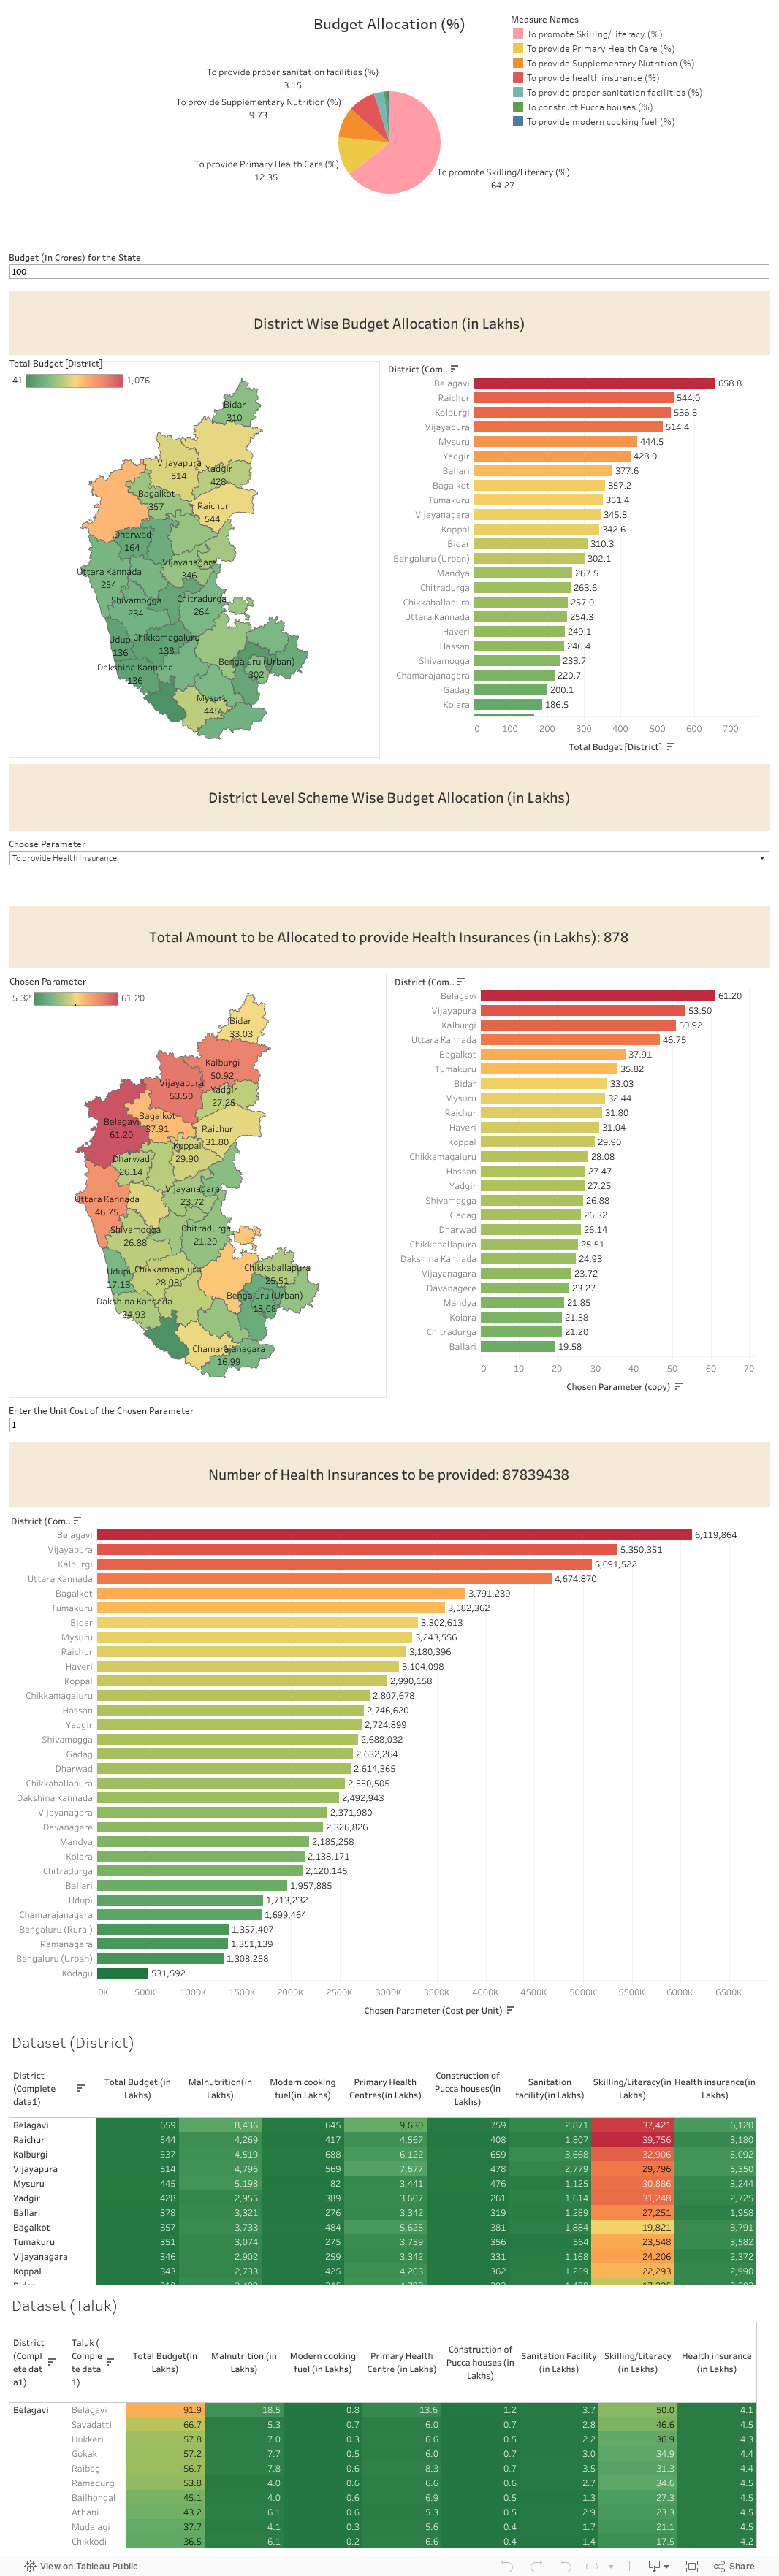
Recommended Budget Allocation
The budget allocation is calculated based on the correlation of the various significant factors with Adolescent Anemic Girls. If a factor has high correlation with Adolescent Anemic Girls, then that factor has to be allocated more budget than others. The method also takes into account the population of each district/taluk and distributes the budget in such a way that if a particular district/taluk has more people who are affected by a factor x, then we allocate more amount to that district/taluk in order to control that factor.