This data story illustrates the impact of different factors that have shown a high correlation with Maternal Mortality rates across taluks and builds predictive models of the expected impact of changing each factor for each district and taluk. Based on the correlations, the recommended budget allocation for different schemes/factors is also given. At the bottom, you can also see an interactive dashboard where you can perform a particular intervention and see whether it is stable or not.
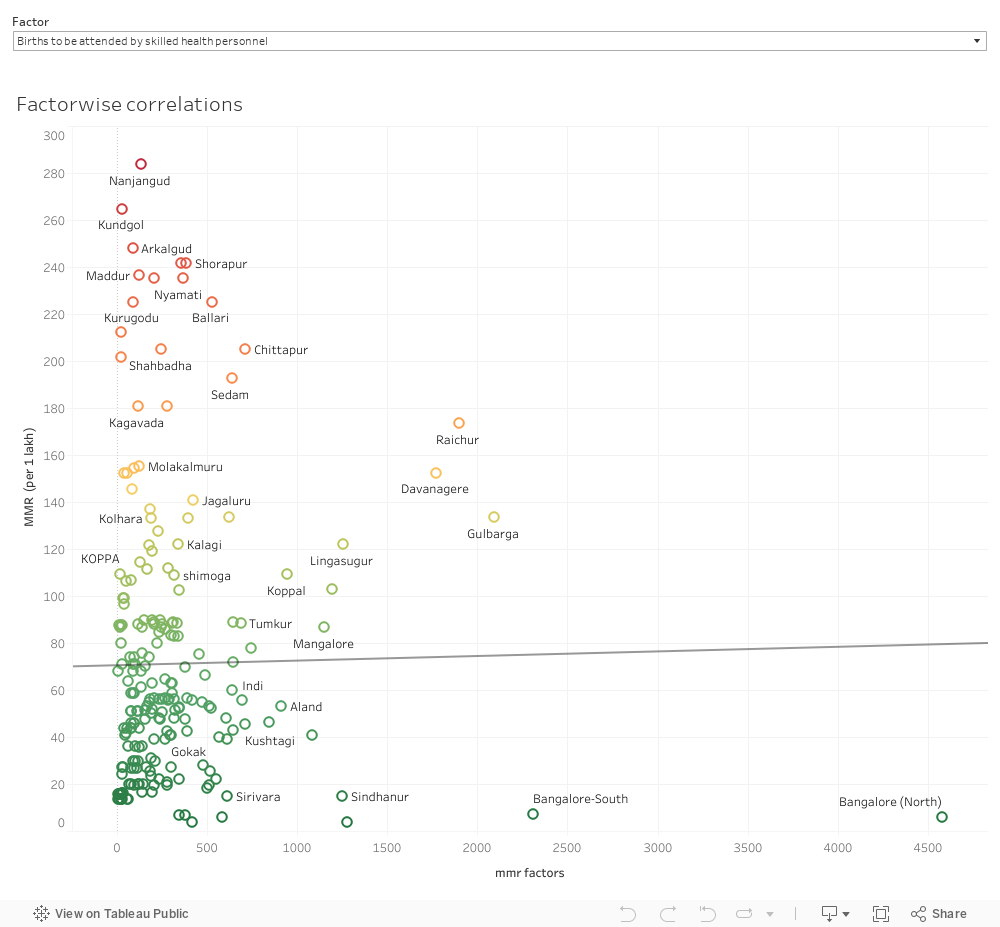
Factor-wise correlations
Factors with significant correlation with Maternal Mortality.
- Deprivation % – Households with with any woman has not received at least 4 antenatal care visits for the most recent birth (+ve correlation)
- Number of Chief Health Officers Working Per 1000 Population (-ve correlation)
- Deprivation % – Households with no sanitation facility (+ve correlation)
- Deprivation % – Households that have inadequate housing material in either floor, roofor wall (+ve correlation)
- Received Health Insurance (%) (+ve correlation)
- No of Pregnant women age 15-49 years who are anaemic(%) (+ve correlation)
- Deprivation % – Households with adult between 15-49 whose BMI is below normal or children under 5 years who are stunted or wasted (+ve correlation)
- Households without a member who completed 6 years of schooling (+ve correlation)
- Multidimensional Poverty Index (%) (+ve correlation)
Factors without significant correlation with Maternal Mortality
- Gap in number of Primary Health Care Doctors
- Deprivation % – Households with Not even one household member has completed six years of schooling.
- Mothers who consumed iron folic acid for 180 days or more when they were pregnant (%)
- Deprivation % – Households that have no electricity
- Number of Asha Working Per 1000 Population
- Per Capita Income (at constant prices)
- Deprivation % – Households which do not own more than one asset (radio, TV, telephone, computer, animal cart, bicycle, motorb 1
- Women aged 20-24 who were married under age 18 yrs
- Deprivation % – Households that cook using solid fuel
- Deprivation % – Households with no safe drinking water or 30 min away
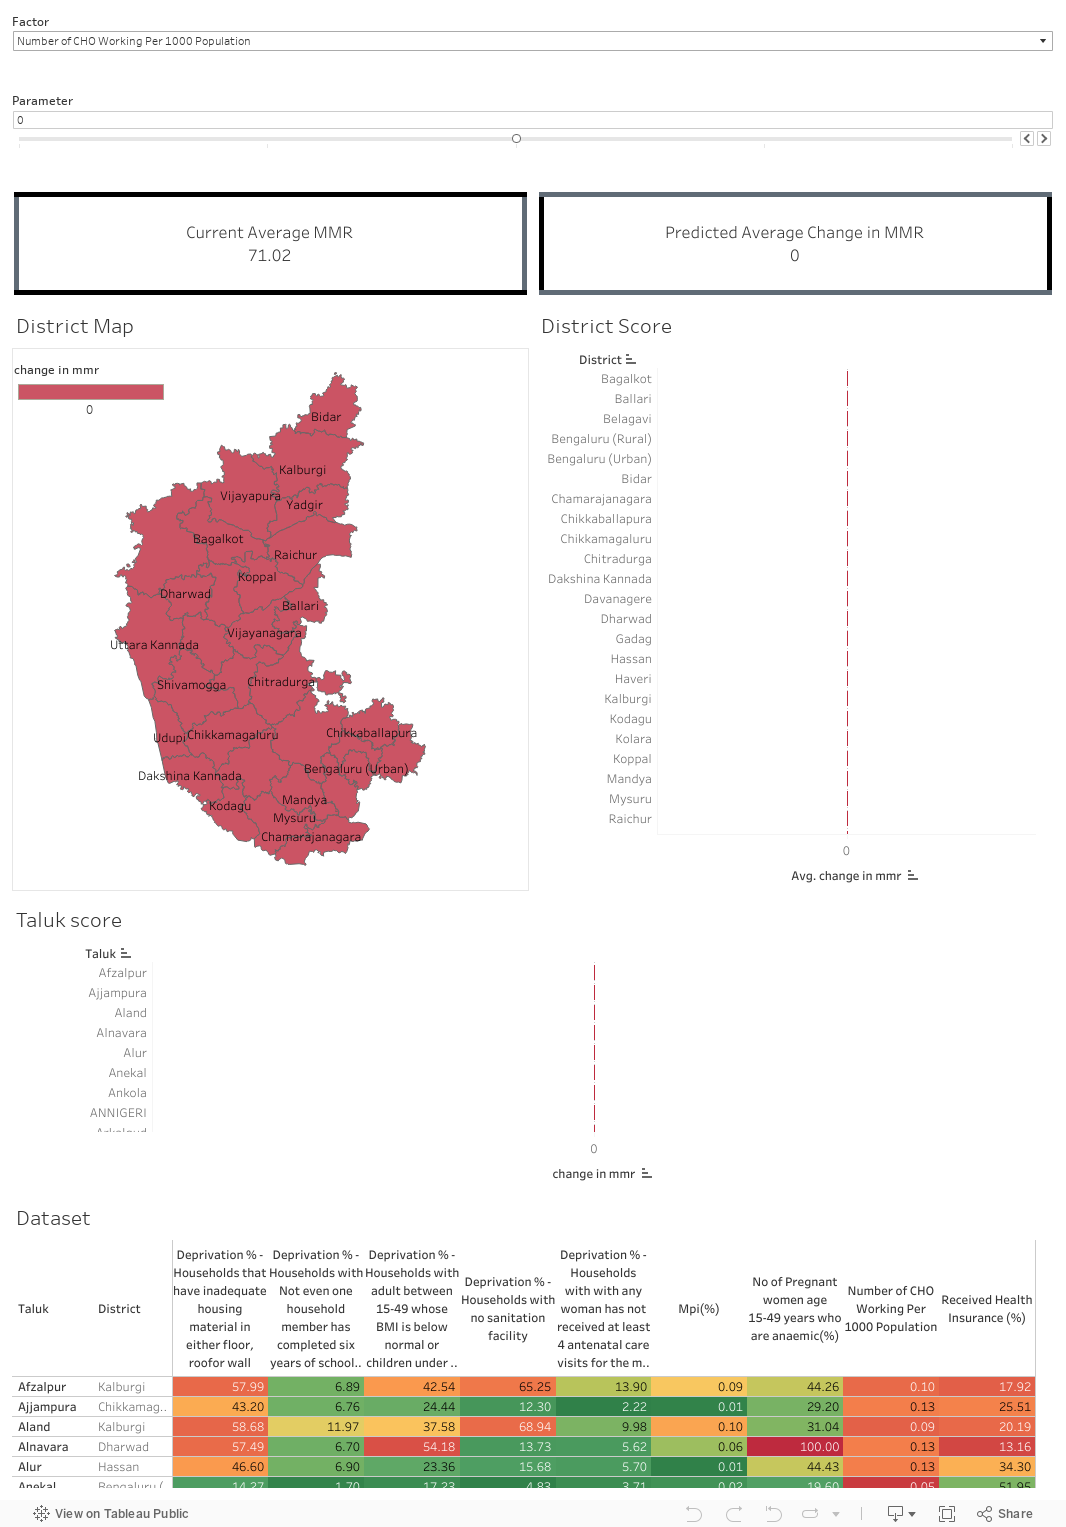
Predictive Impact Analysis
To see the impact of each of these factors, click on the tabs given above. Every dashboard has a slider using which, you can change the factor of interest. Initially, the slider is at 0%. If you want to decrease the factor by 10%, you can move the slider to the left. Similarly, if you want to increase the factor by 10%, you can move the slider to the right.
For example, say you want to decrease the percentage of mothers with less than 4 ANC visits by 20% of the current value, you can do it by moving the slider two times to the left (which corresponds to -20%)
The dashboards has district level map as well as taluk level map. The colours on these maps represent the change in maternal mortality after making the desired change in the factor of interest. If you click on a particular district in the district level map, you get a magnified image of those taluks belonging to the selected district.
Below the maps, you can see the score of each taluk sorted in descending order. The scoring is based on how good each taluk has performed in changing yield after changing the factor.
At the very bottom, you can see the dataset that is being used for making this interactive visualization
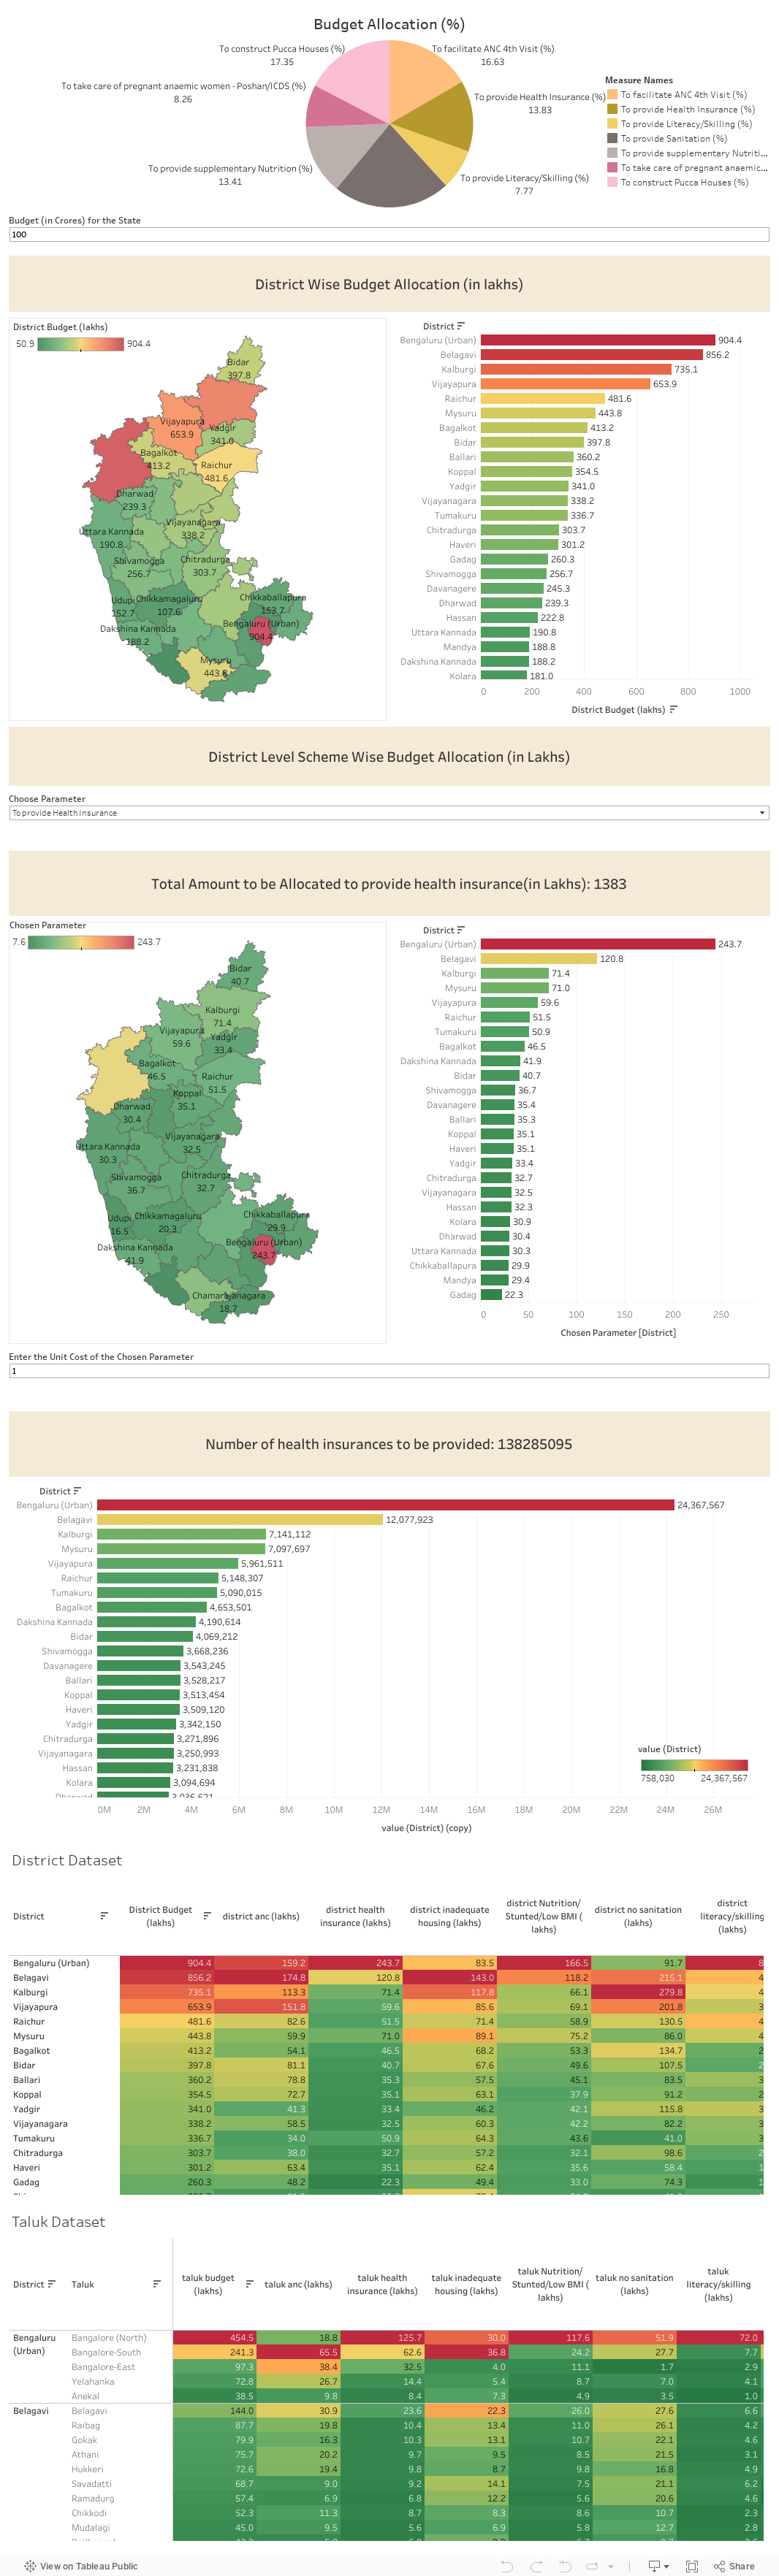
Recommended Budget Allocation
The budget allocation is calculated based on the correlation of the various significant factors with MMR. If a factor has high correlation with MMR, then that factor has to be allocated more budget than others. The method also takes into account the population of each district/taluk and distributes the budget in such a way that if a particular district/taluk has more people who are affected by a factor x, then we allocate more amount to that district/taluk in order to control that factor.