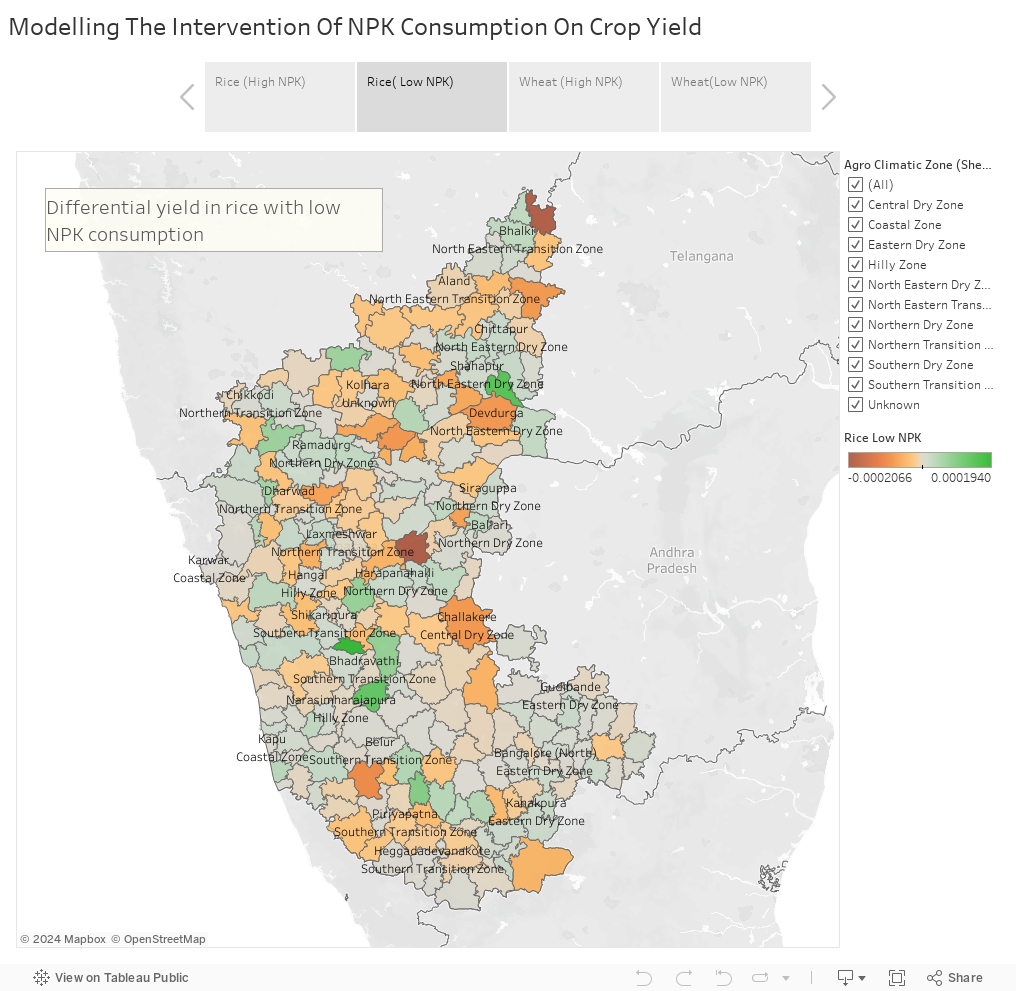
The below map shows how the yield changes with high and low NPK consumption for two crops: Rice and wheat.