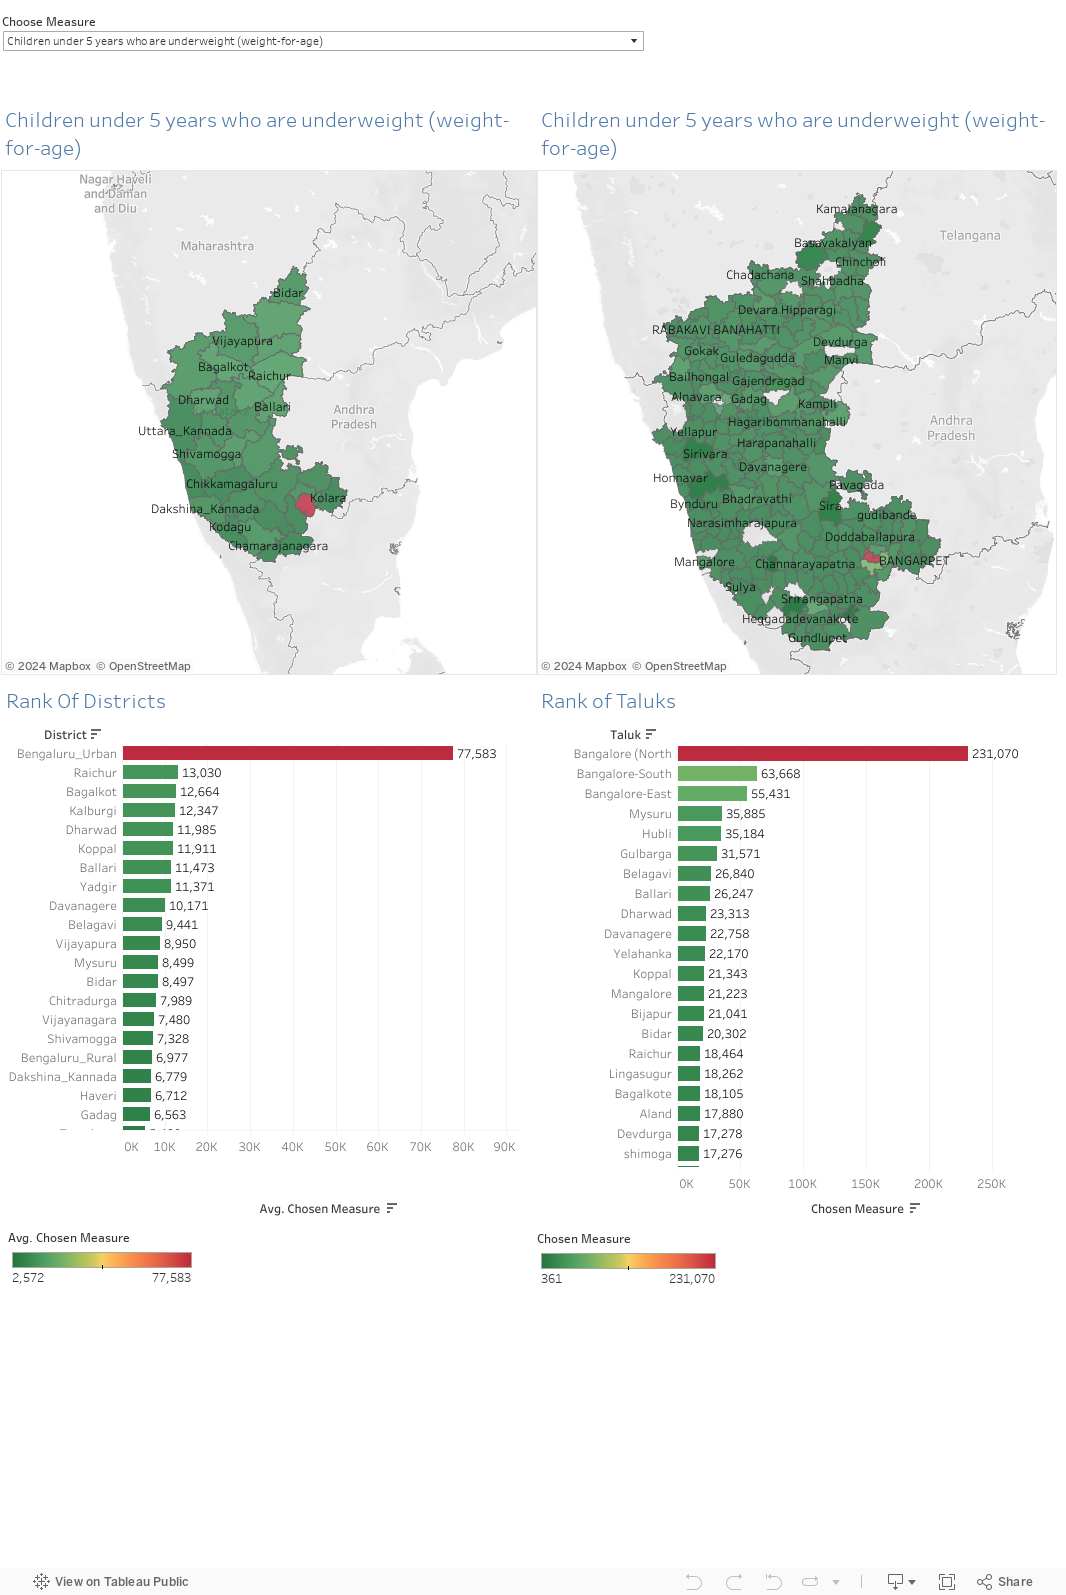
By clicking on the drop down below, you can select different fields that you want to visualize. The first map represents the intensity of the field that you selected at a district level. The second map represents the same at a taluk level. By clicking on a particular district, all the taluks belonging to that district will get magnified. On the right hand side, the ranks of district and taluks are also displayed.
Relevant indicators: 2.2.4
Relevant datasets: Anemia Mukta Karnataka