This data story analyses various factors from multiple sources that are highly correlated with the Pregnant Anaemic Women at the taluk level and uses predictive analysis to estimate the impact of changes in each factor on districts and taluks. The interactive dashboards are based on the report “Indicators And Its Impact Across Poverty, Health & Education Sectors“. Please click here to view/download the report.
The report Outcome-based SDG budget- Health and Nutrition outline the components of the following data story and gives taluka-specific budget recommendations based on outcomes for each relevant factor. Please click here to view/download the report and the dataset.
Pregnant Anaemic Women Factors
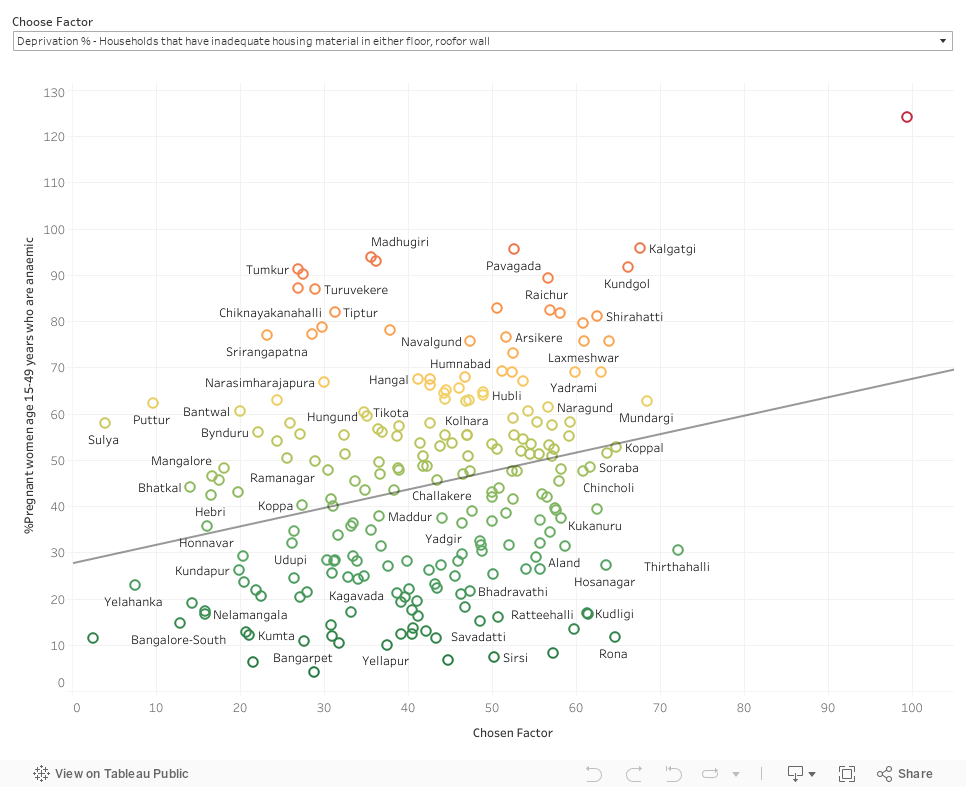
Factors with significant correlation with Pregnant Anaemic Women:
1. Deprivation % – Households with no sanitation facility.
2. Deprivation % – No household member has a bank account or a post office account.
3. Deprivation % – Households with no safe drinking water or 30 min away.
4. Deprivation % – Households that cook using solid fuel.
5. Deprivation % – Households that have inadequate housing material in either floor, roofor wall.
6. Deprivation % – Households with Any school age children not attending school (6-14).
7. Deprivation % – Households with Not even one household member has completed six years of schooling.
8. Deprivation % – Households with adult between 15-49 whose BMI is below normal or children under 5 years who are stunted or wasted.
9. Average prevalence of Anaemia %
Factors without significant correlation with Pregnant Anaemic Women:
1. Deprivation % – Households with with any woman has not received at least 4 antenatal care visits for the most recent birth.
2. Number of Asha Working Per 1000 Population.
3. Number of Chief Health Officer Working Per 1000 Population.
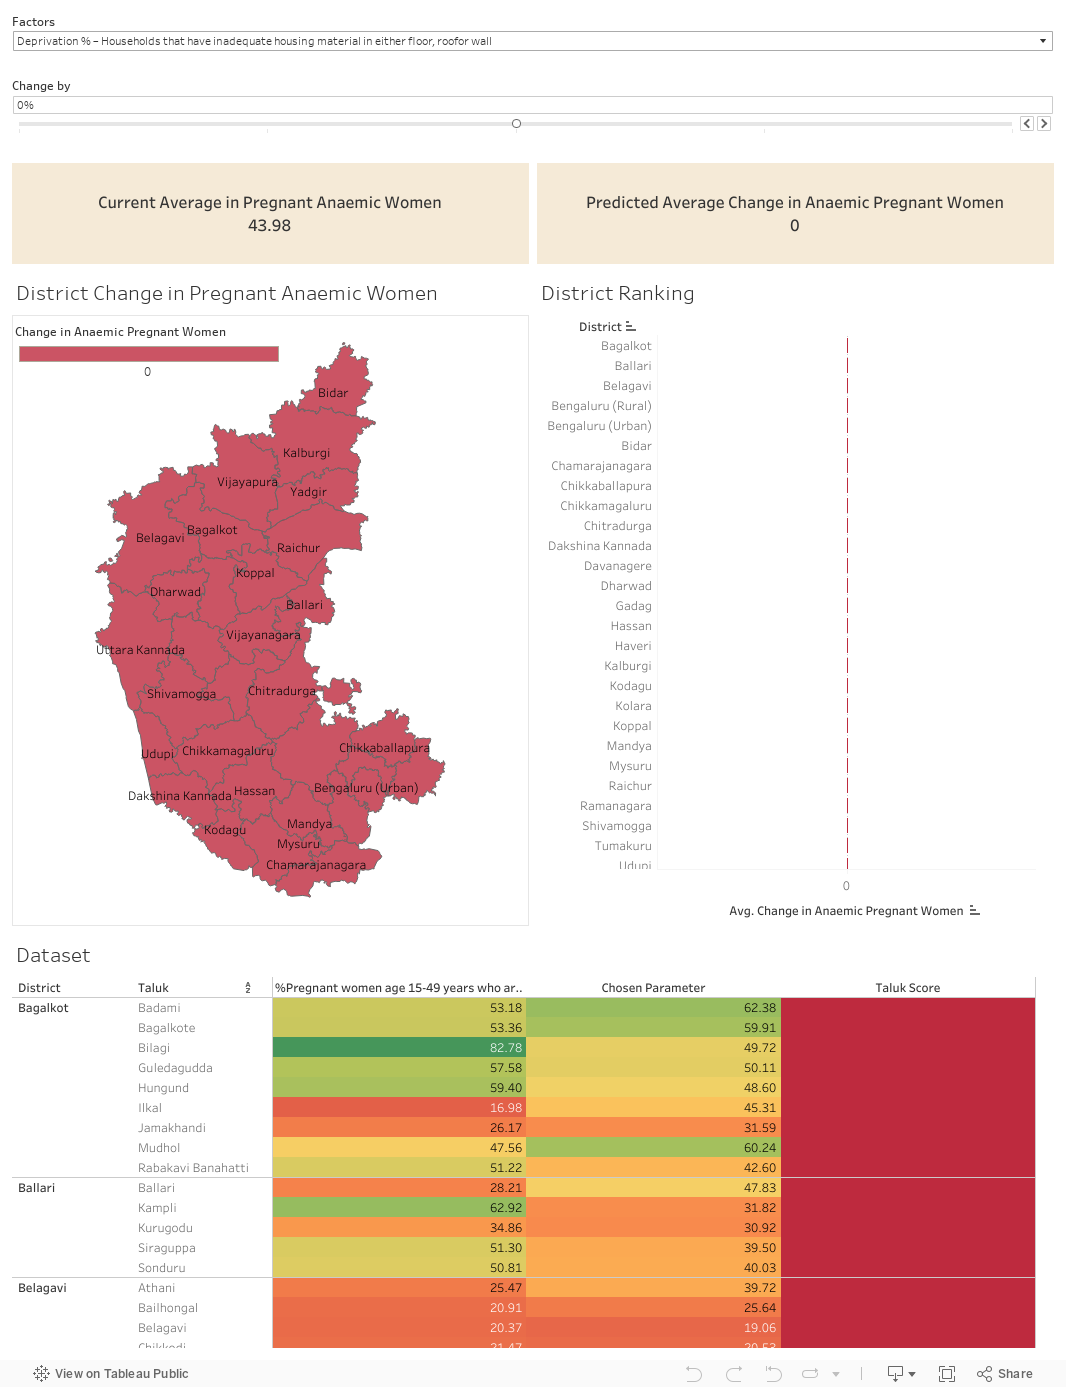
Predictive Impact Analysis
The dashboard has a slider using which, you can change the factor of interest. Initially, the slider is at 0%. If you want to decrease the factor by 10%, you can move the slider to the left. Similarly, if you want to increase the factor by 10%, you can move the slider to the right.
For example, say you want to decrease the ‘Deprivation % = Households with no sanitation facility’ by 20% of the current value, you can do it by moving the slider two times to the left (which corresponds to -20%)
The dashboards has district level map as well as taluk level map. The colours on these maps represent the change in anaemia after making the desired change in the factor of interest. If you hover over a particular district in the district level map, you get a magnified image of those taluks belonging to the selected district.
Below the maps, you can see the score of each taluk sorted in descending order. The scoring is based on how good each taluk has performed in changing yield after changing the factor.
At the very bottom, you can see the dataset that is being used for making this interactive visualization
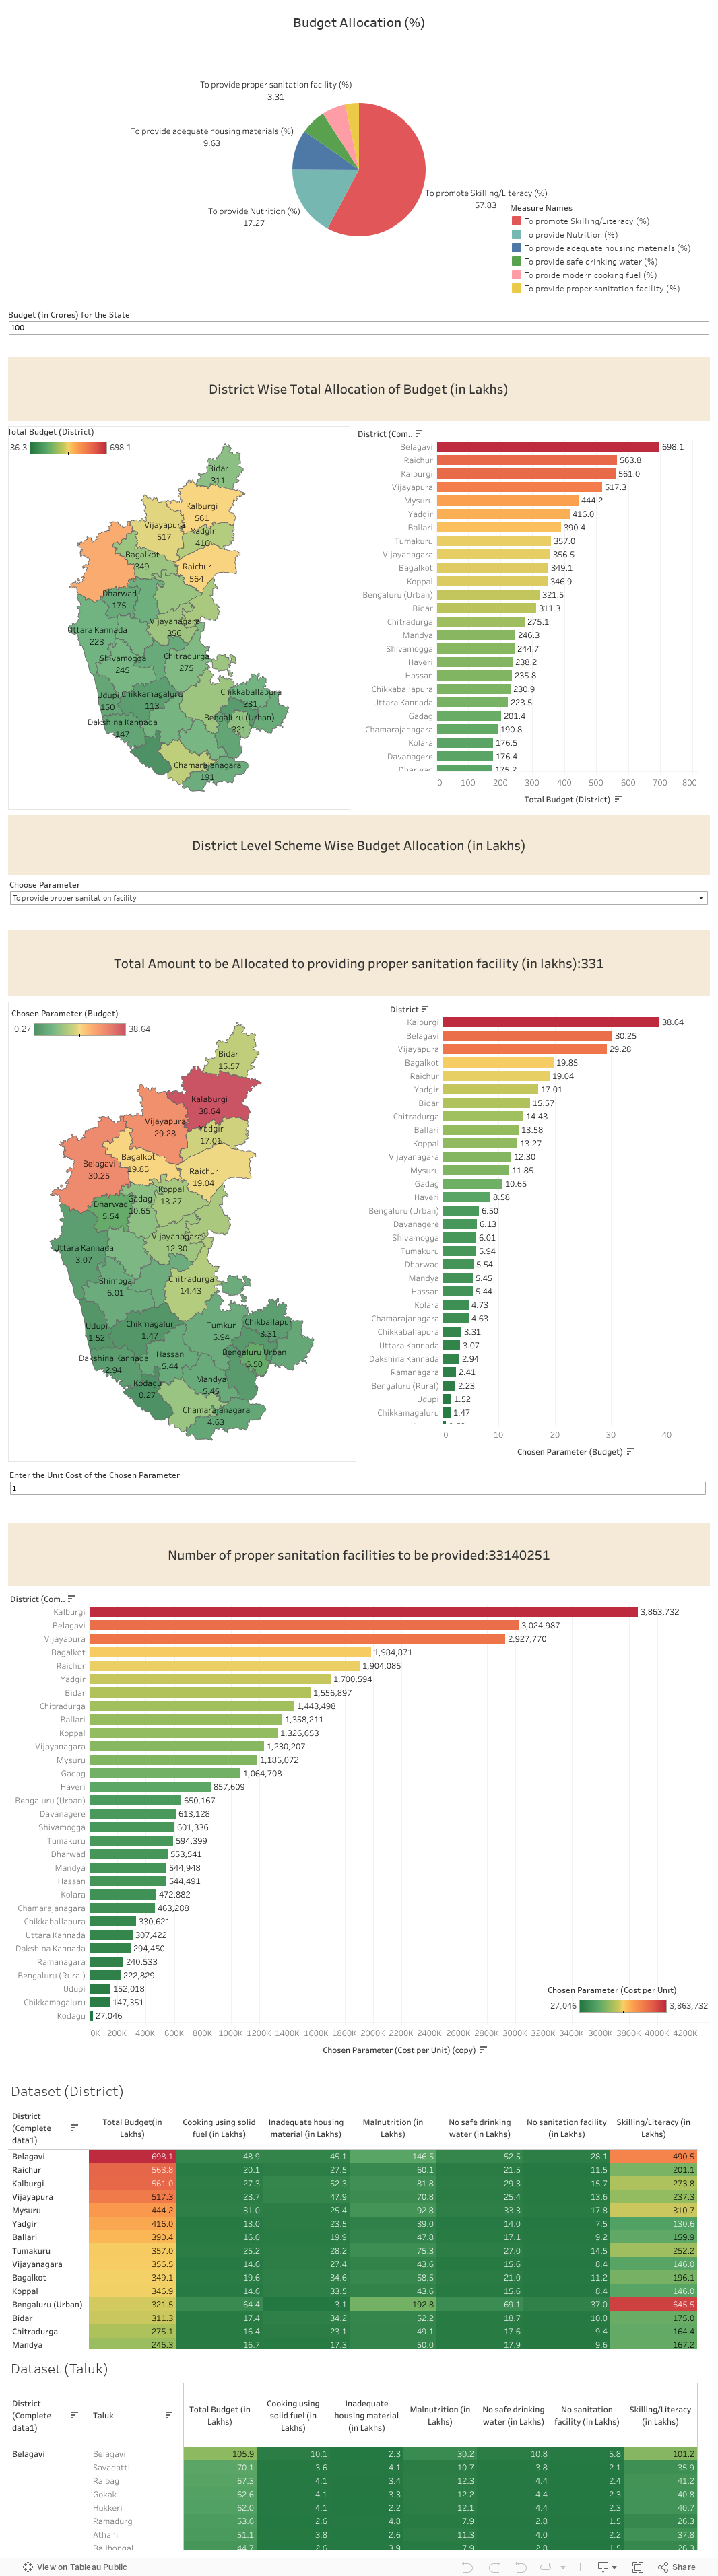
Recommended Budget Allocation for Pregnant Anemic Women
The budget allocation is calculated based on the correlation of the various significant factors with Pregnant Anemic Women. If a factor has high correlation with Pregnant Anemic Woman, then that factor has to be allocated more budget than others. The method also takes into account the population of each district/taluk and distributes the budget in such a way that if a particular district/taluk has more people who are affected by a factor x, then we allocate more amount to that district/taluk in order to control that factor.