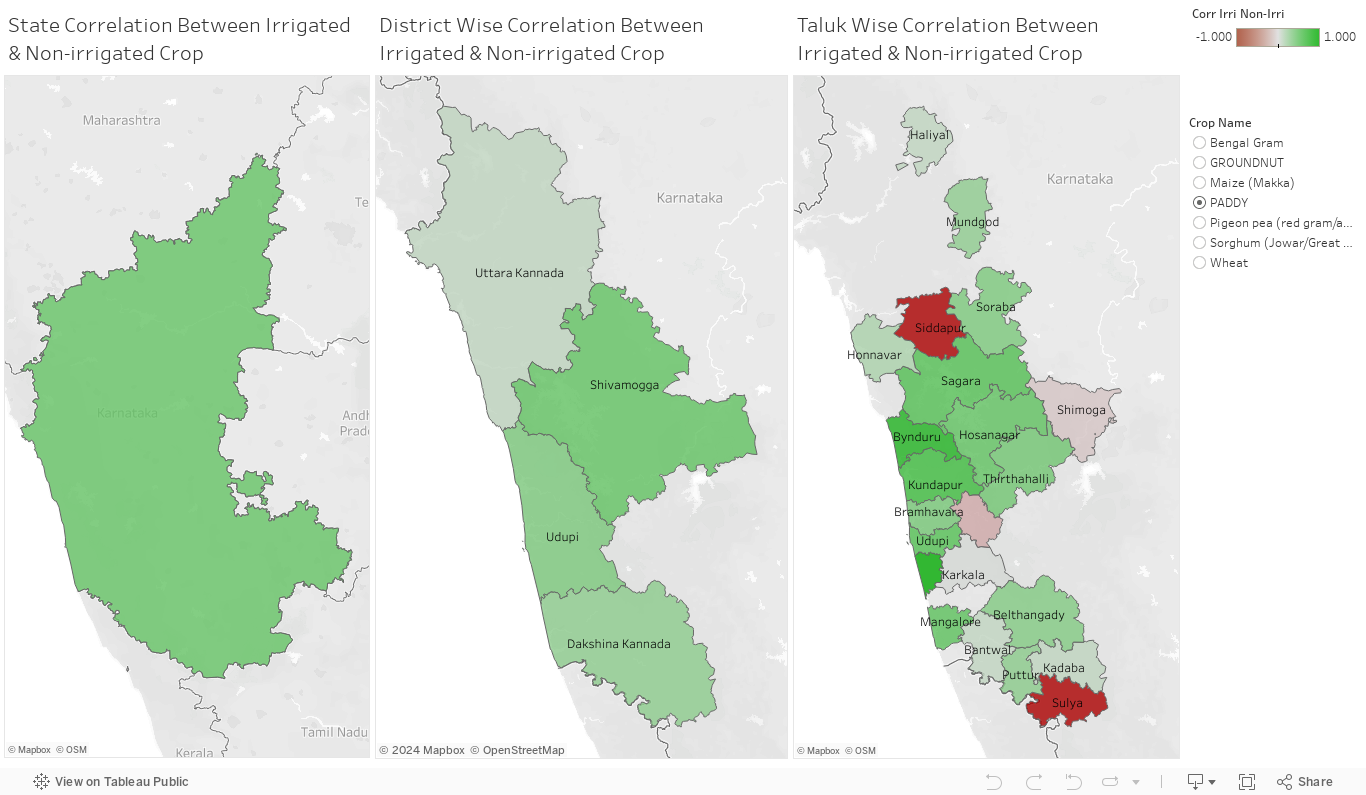
The below visualization shows the correlation between irrigated and non-irrigated crop at a state level, district-level and taluk level. You can select the crop for which you want to find this correlation from the right hand side of the page. Green colour shows that there is positive correlation and red colour shows that there is negative correlation. Colours are shown only for taluks/GPs for which a particular crop is grown both irrigated and non-irrigated.
Datasets Used:- Crop Cutting Dataset